| Outcome | RCT | Neuraxial | General | GRADE* | Effect | Estimate (95% CI) |
|---|---|---|---|---|---|---|
| N (Total) | N (Total) | |||||
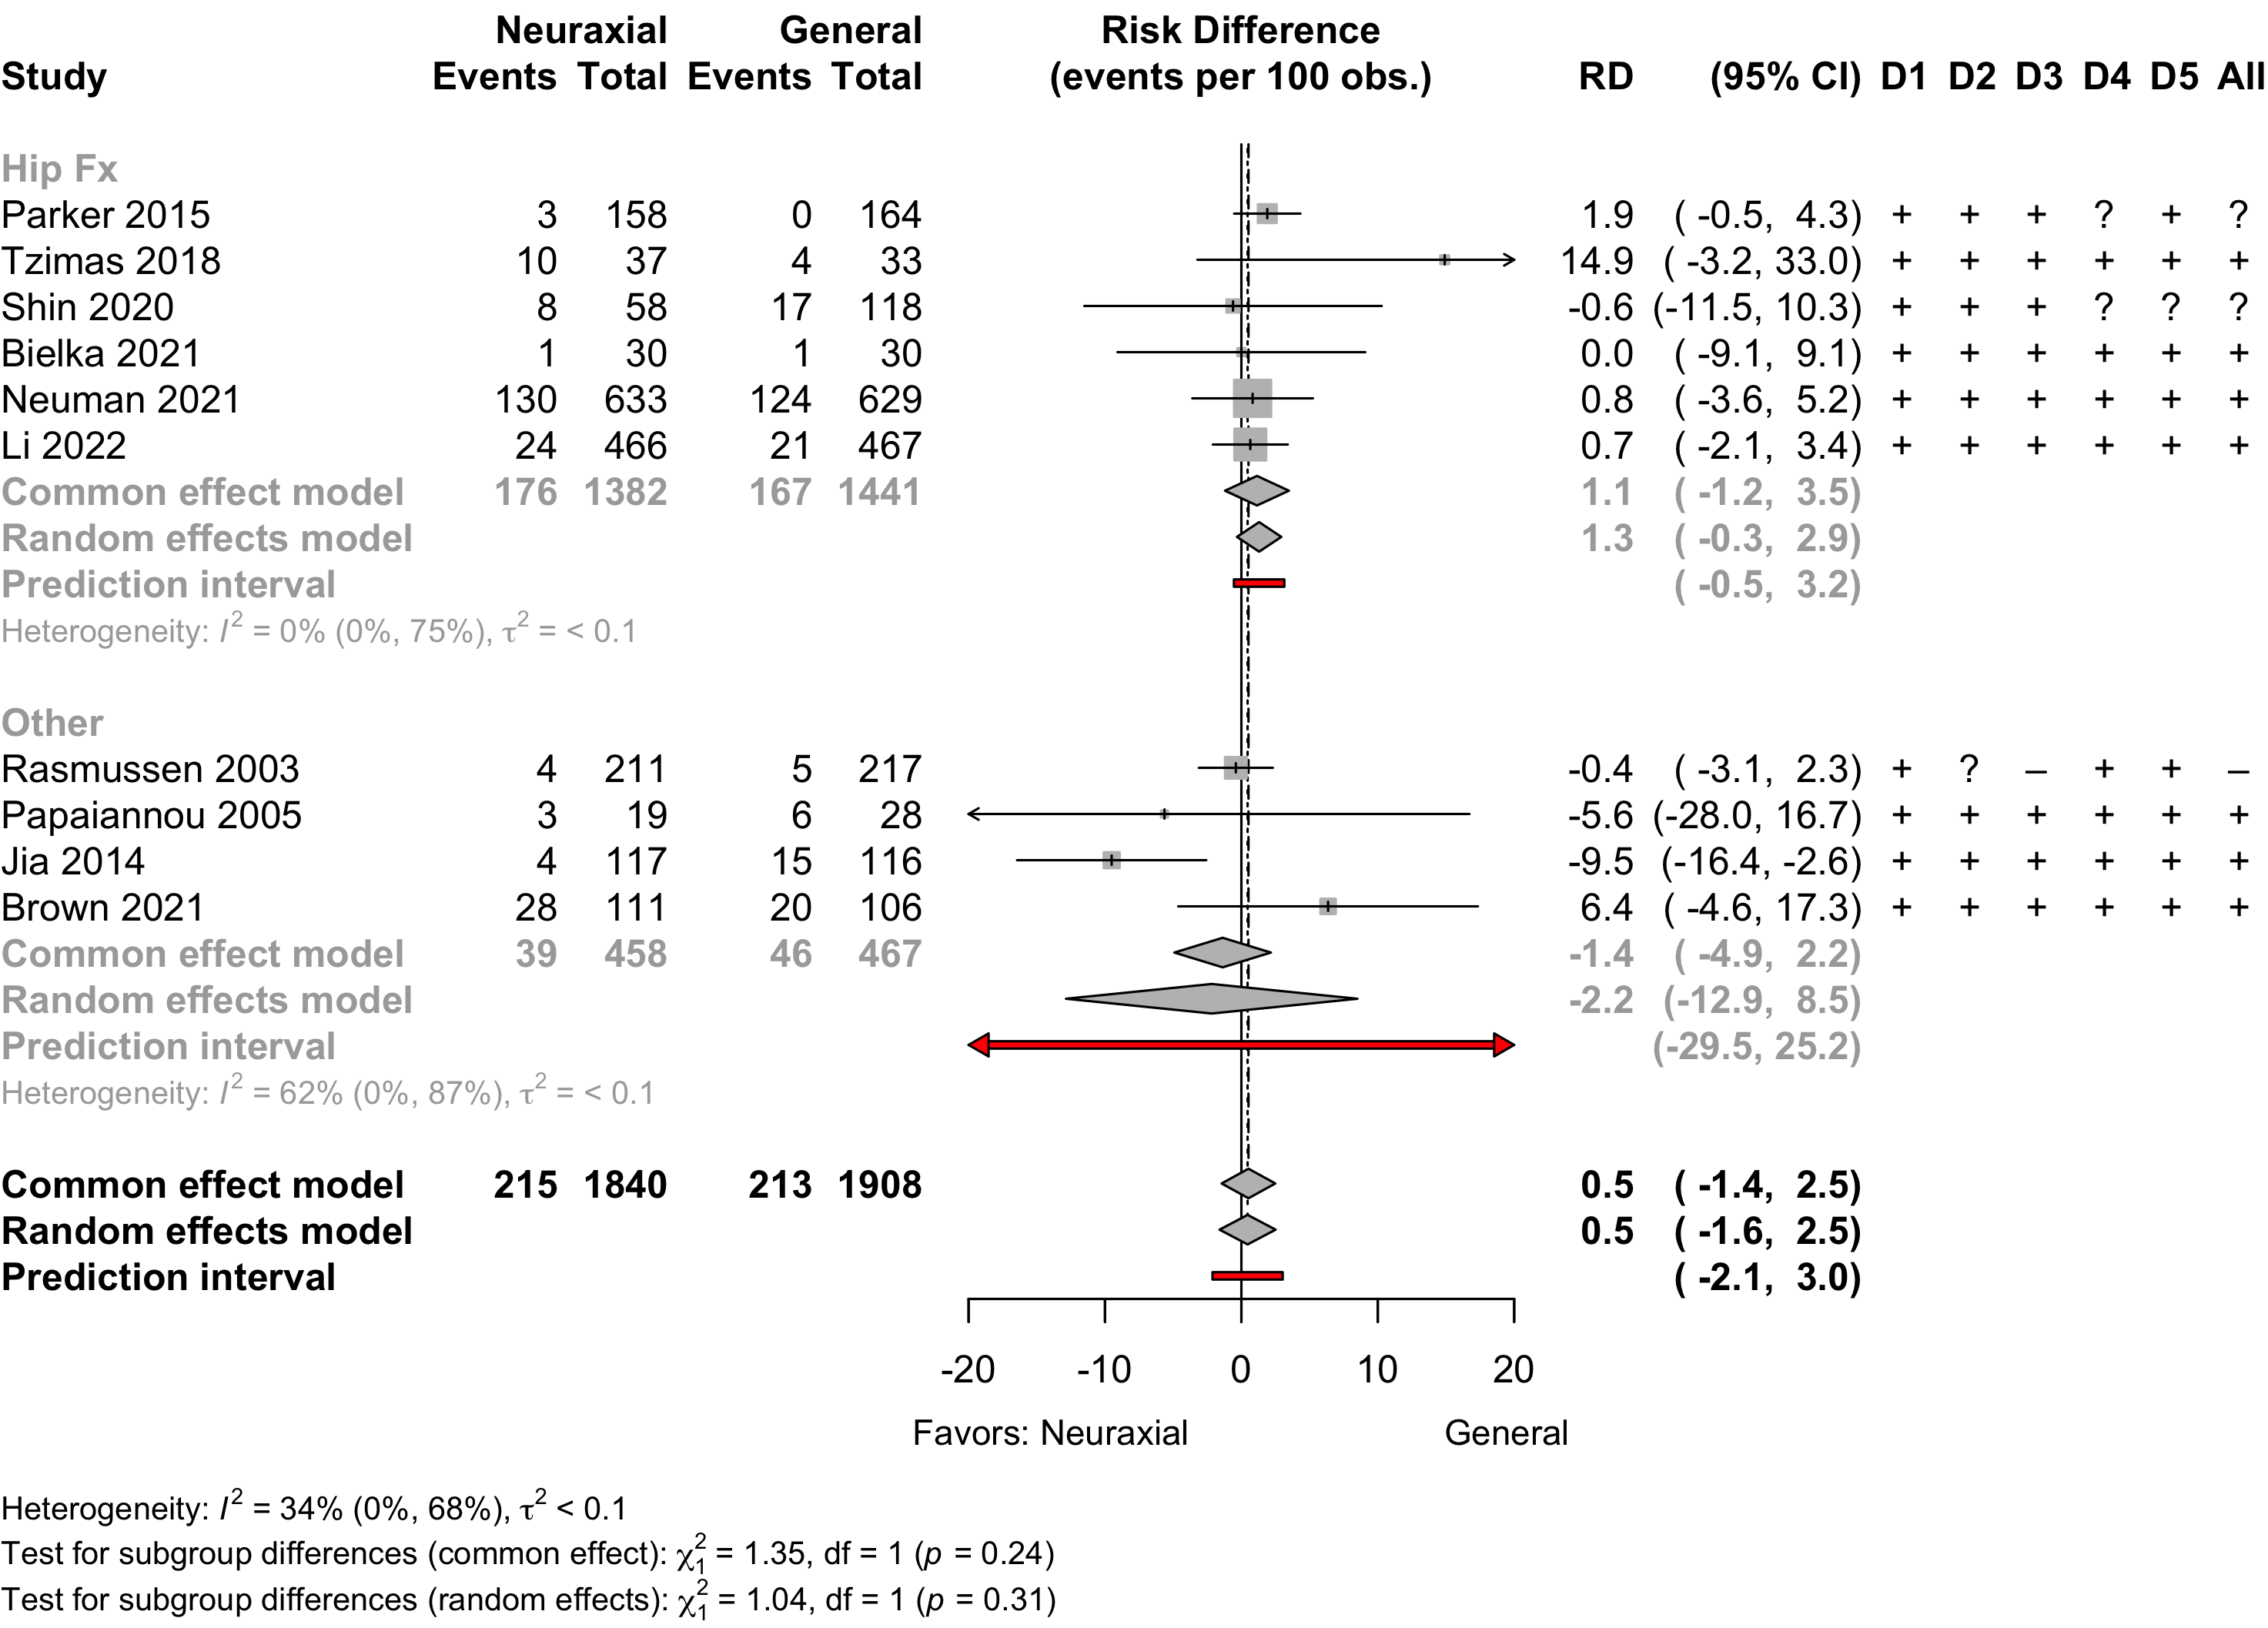
| Delirium | 10 | 215 (1,840) | 213 (1,908) | RR | 1.06 (0.84–1.33)†,‡ | |
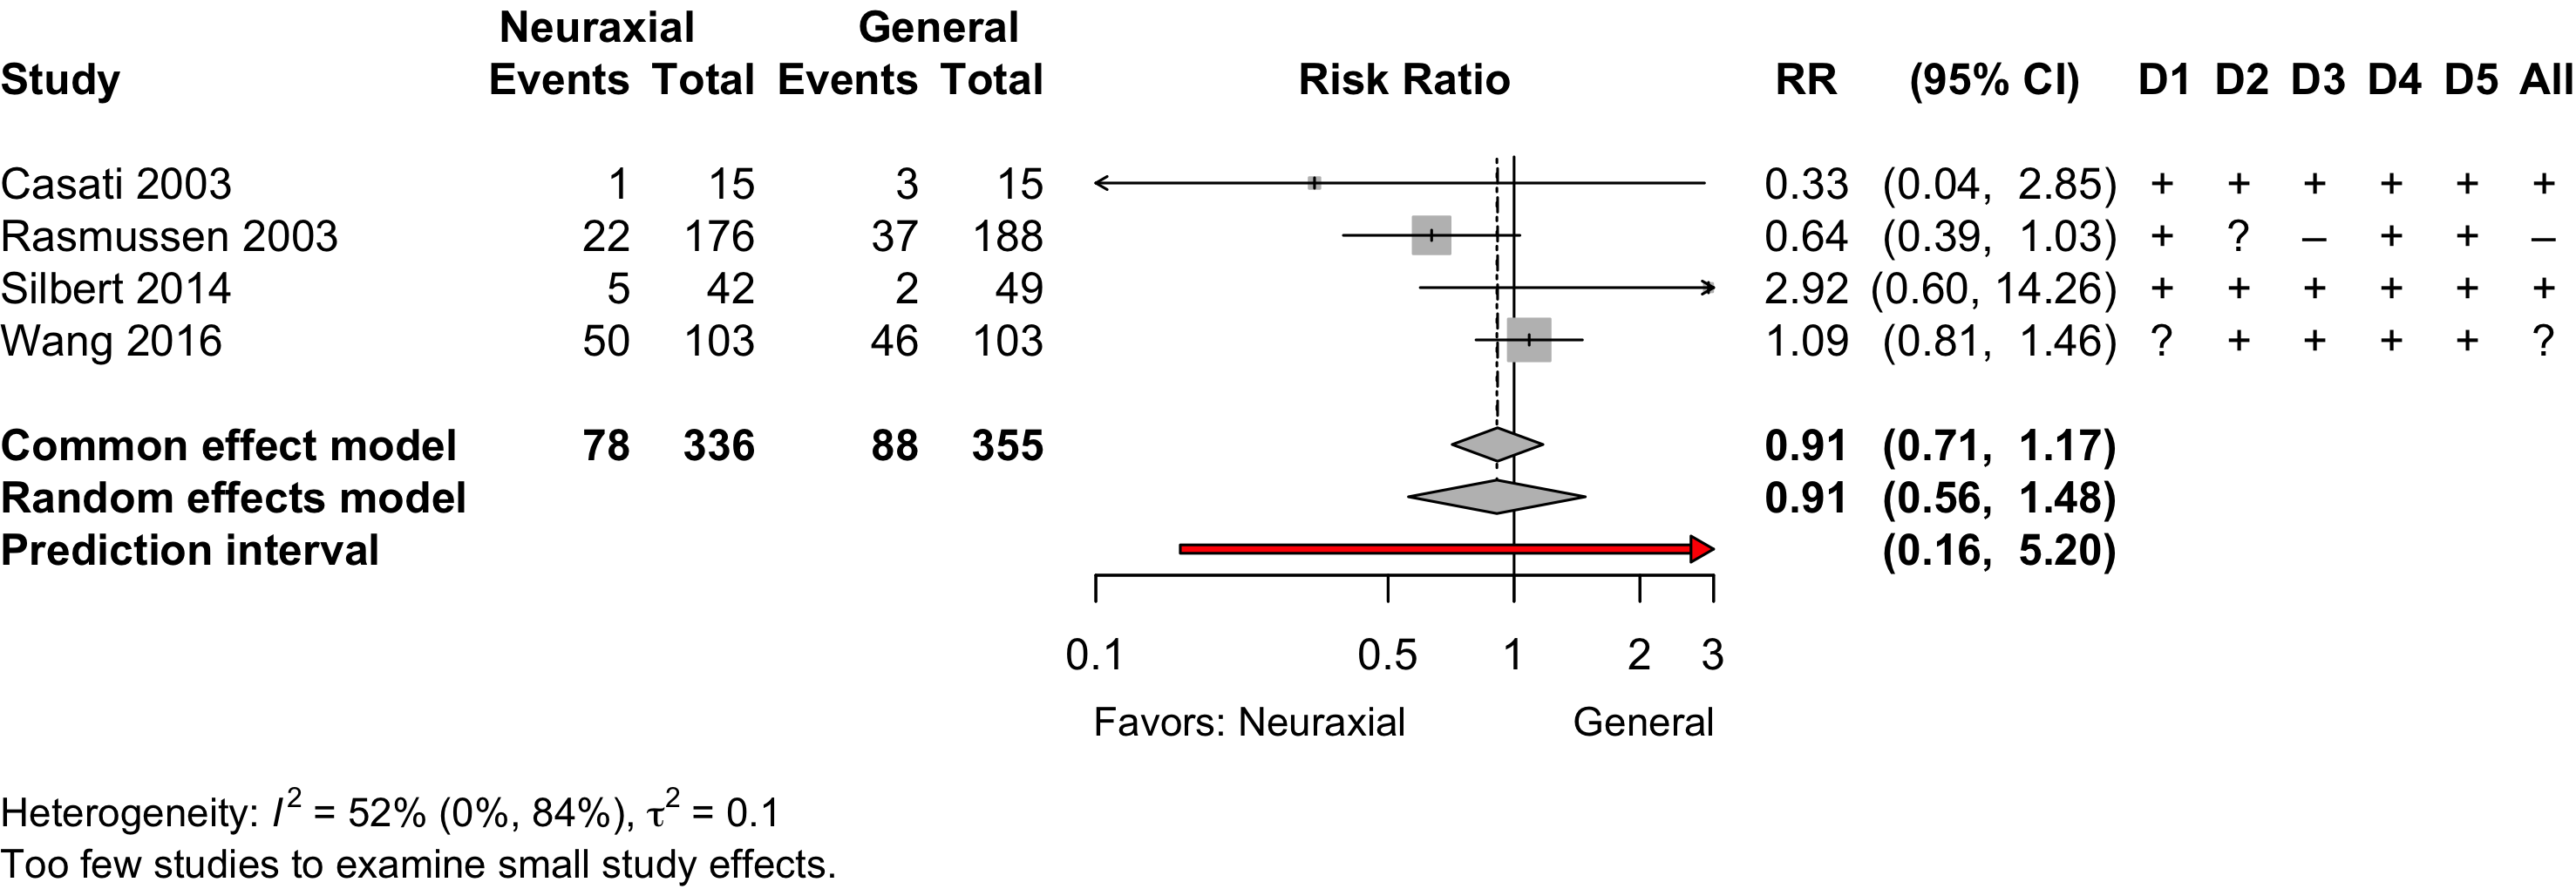
| Neurocognitive disorder <30 days | 4 | 78 (336) | 88 (355) | RR | 0.91 (0.56–1.48) | |
| Neurocognitive disorder 30 days to 1 yr | 1 | 23 (176) | 25 (188) | RR | 0.98 (0.58–1.67) | |
| Physical function | 3 | (355) | (371) | SMD | 0.01 (-0.39 to 0.42)§ | |
| Complications** | 13 | see below | ||||
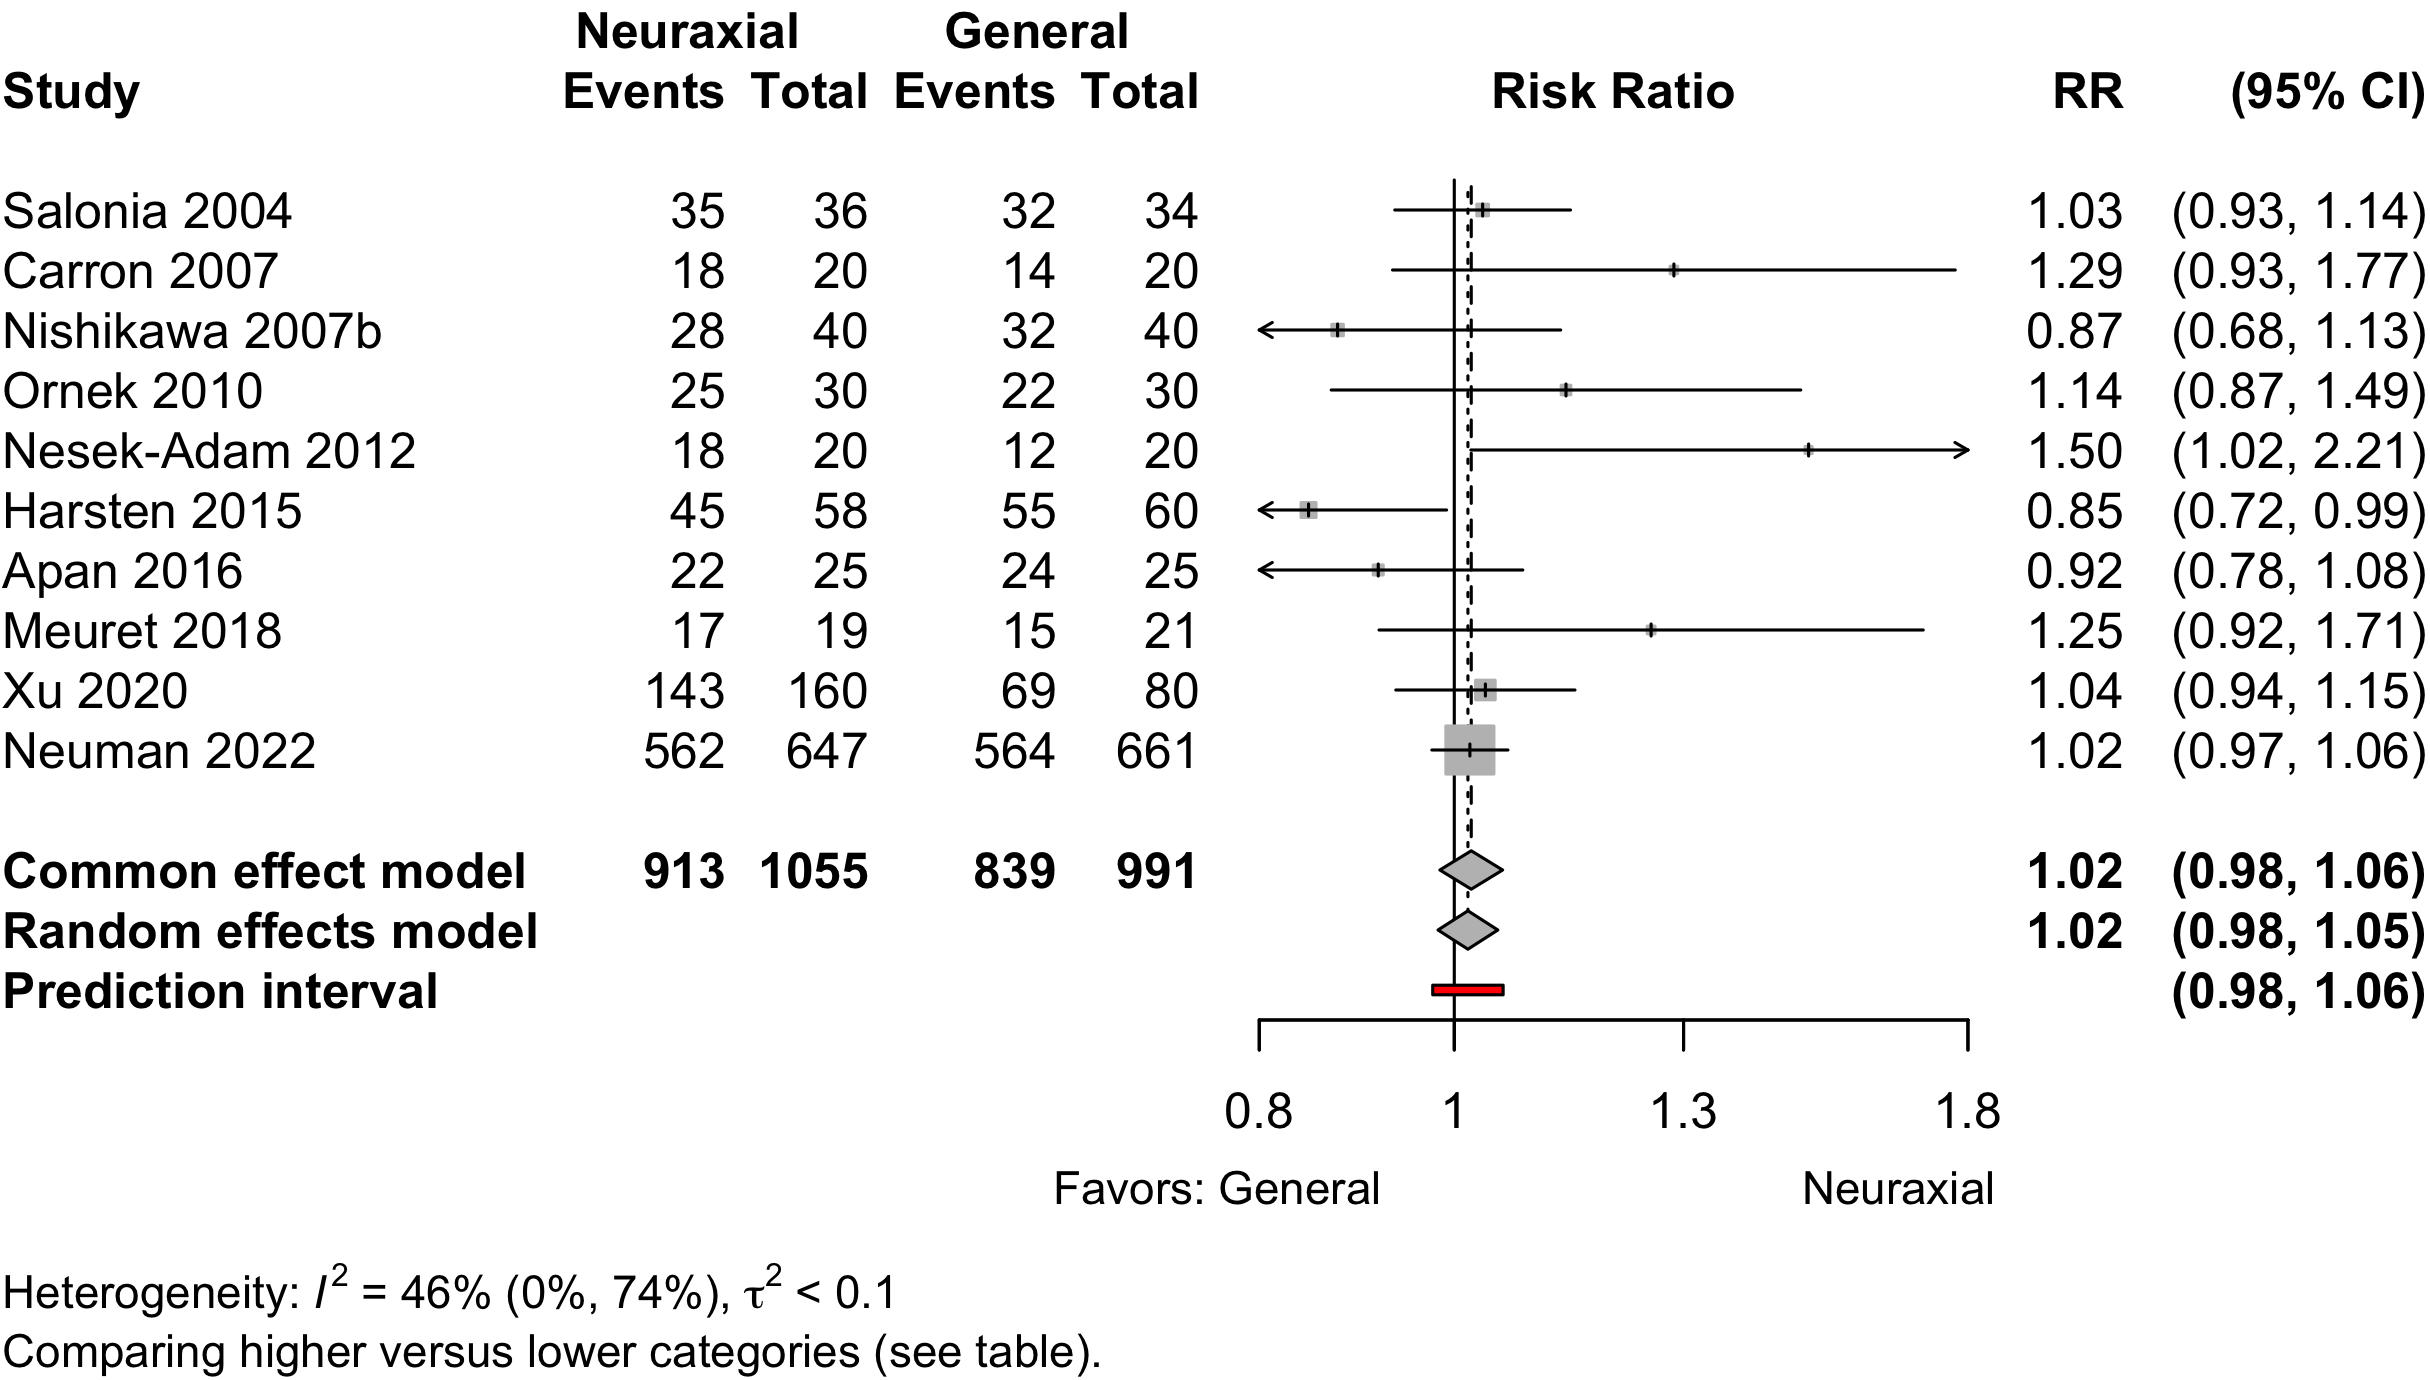
| Patient satisfaction | 10 | 913 (1,055) | 839 (991) | RR | 1.02 (0.98–1.05)†† | |
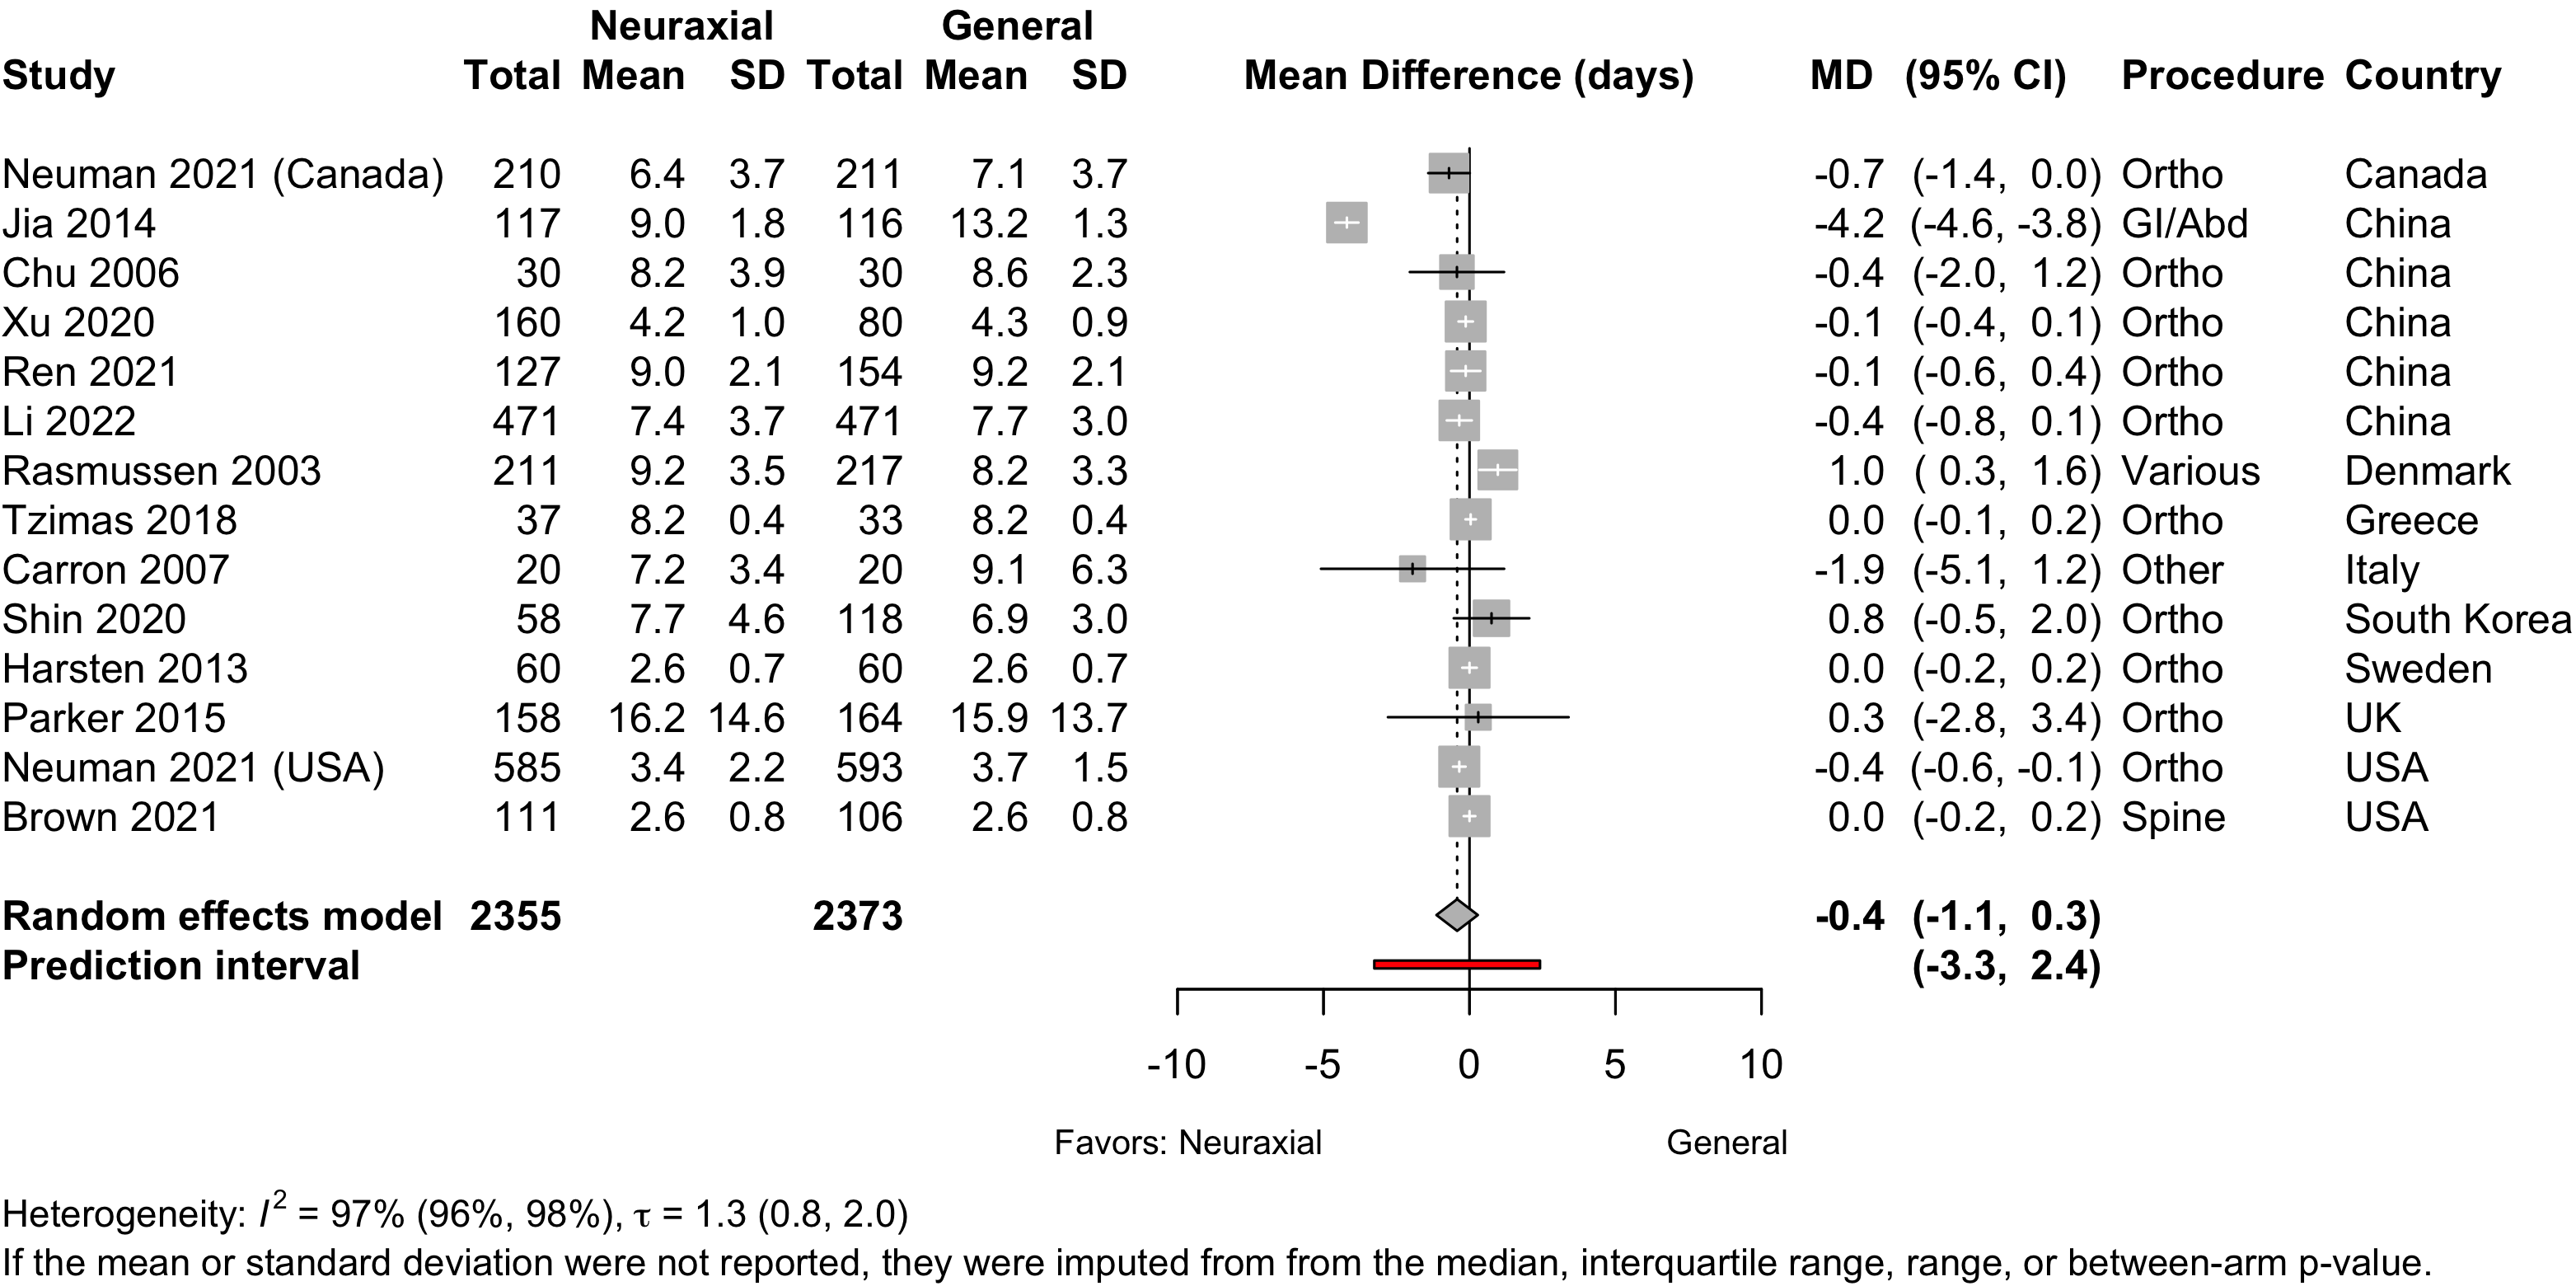
| Length of stay (days) | 13 | (2,355) | (2,373) | MD | -0.4 (-1.1 to 0.3) | |
| Discharged to institution | 1 | 576 (777) | 586 (777) | RR | 0.98 (0.93-1.04) | |
| Mortality (in-hospital and 30-day) | ||||||
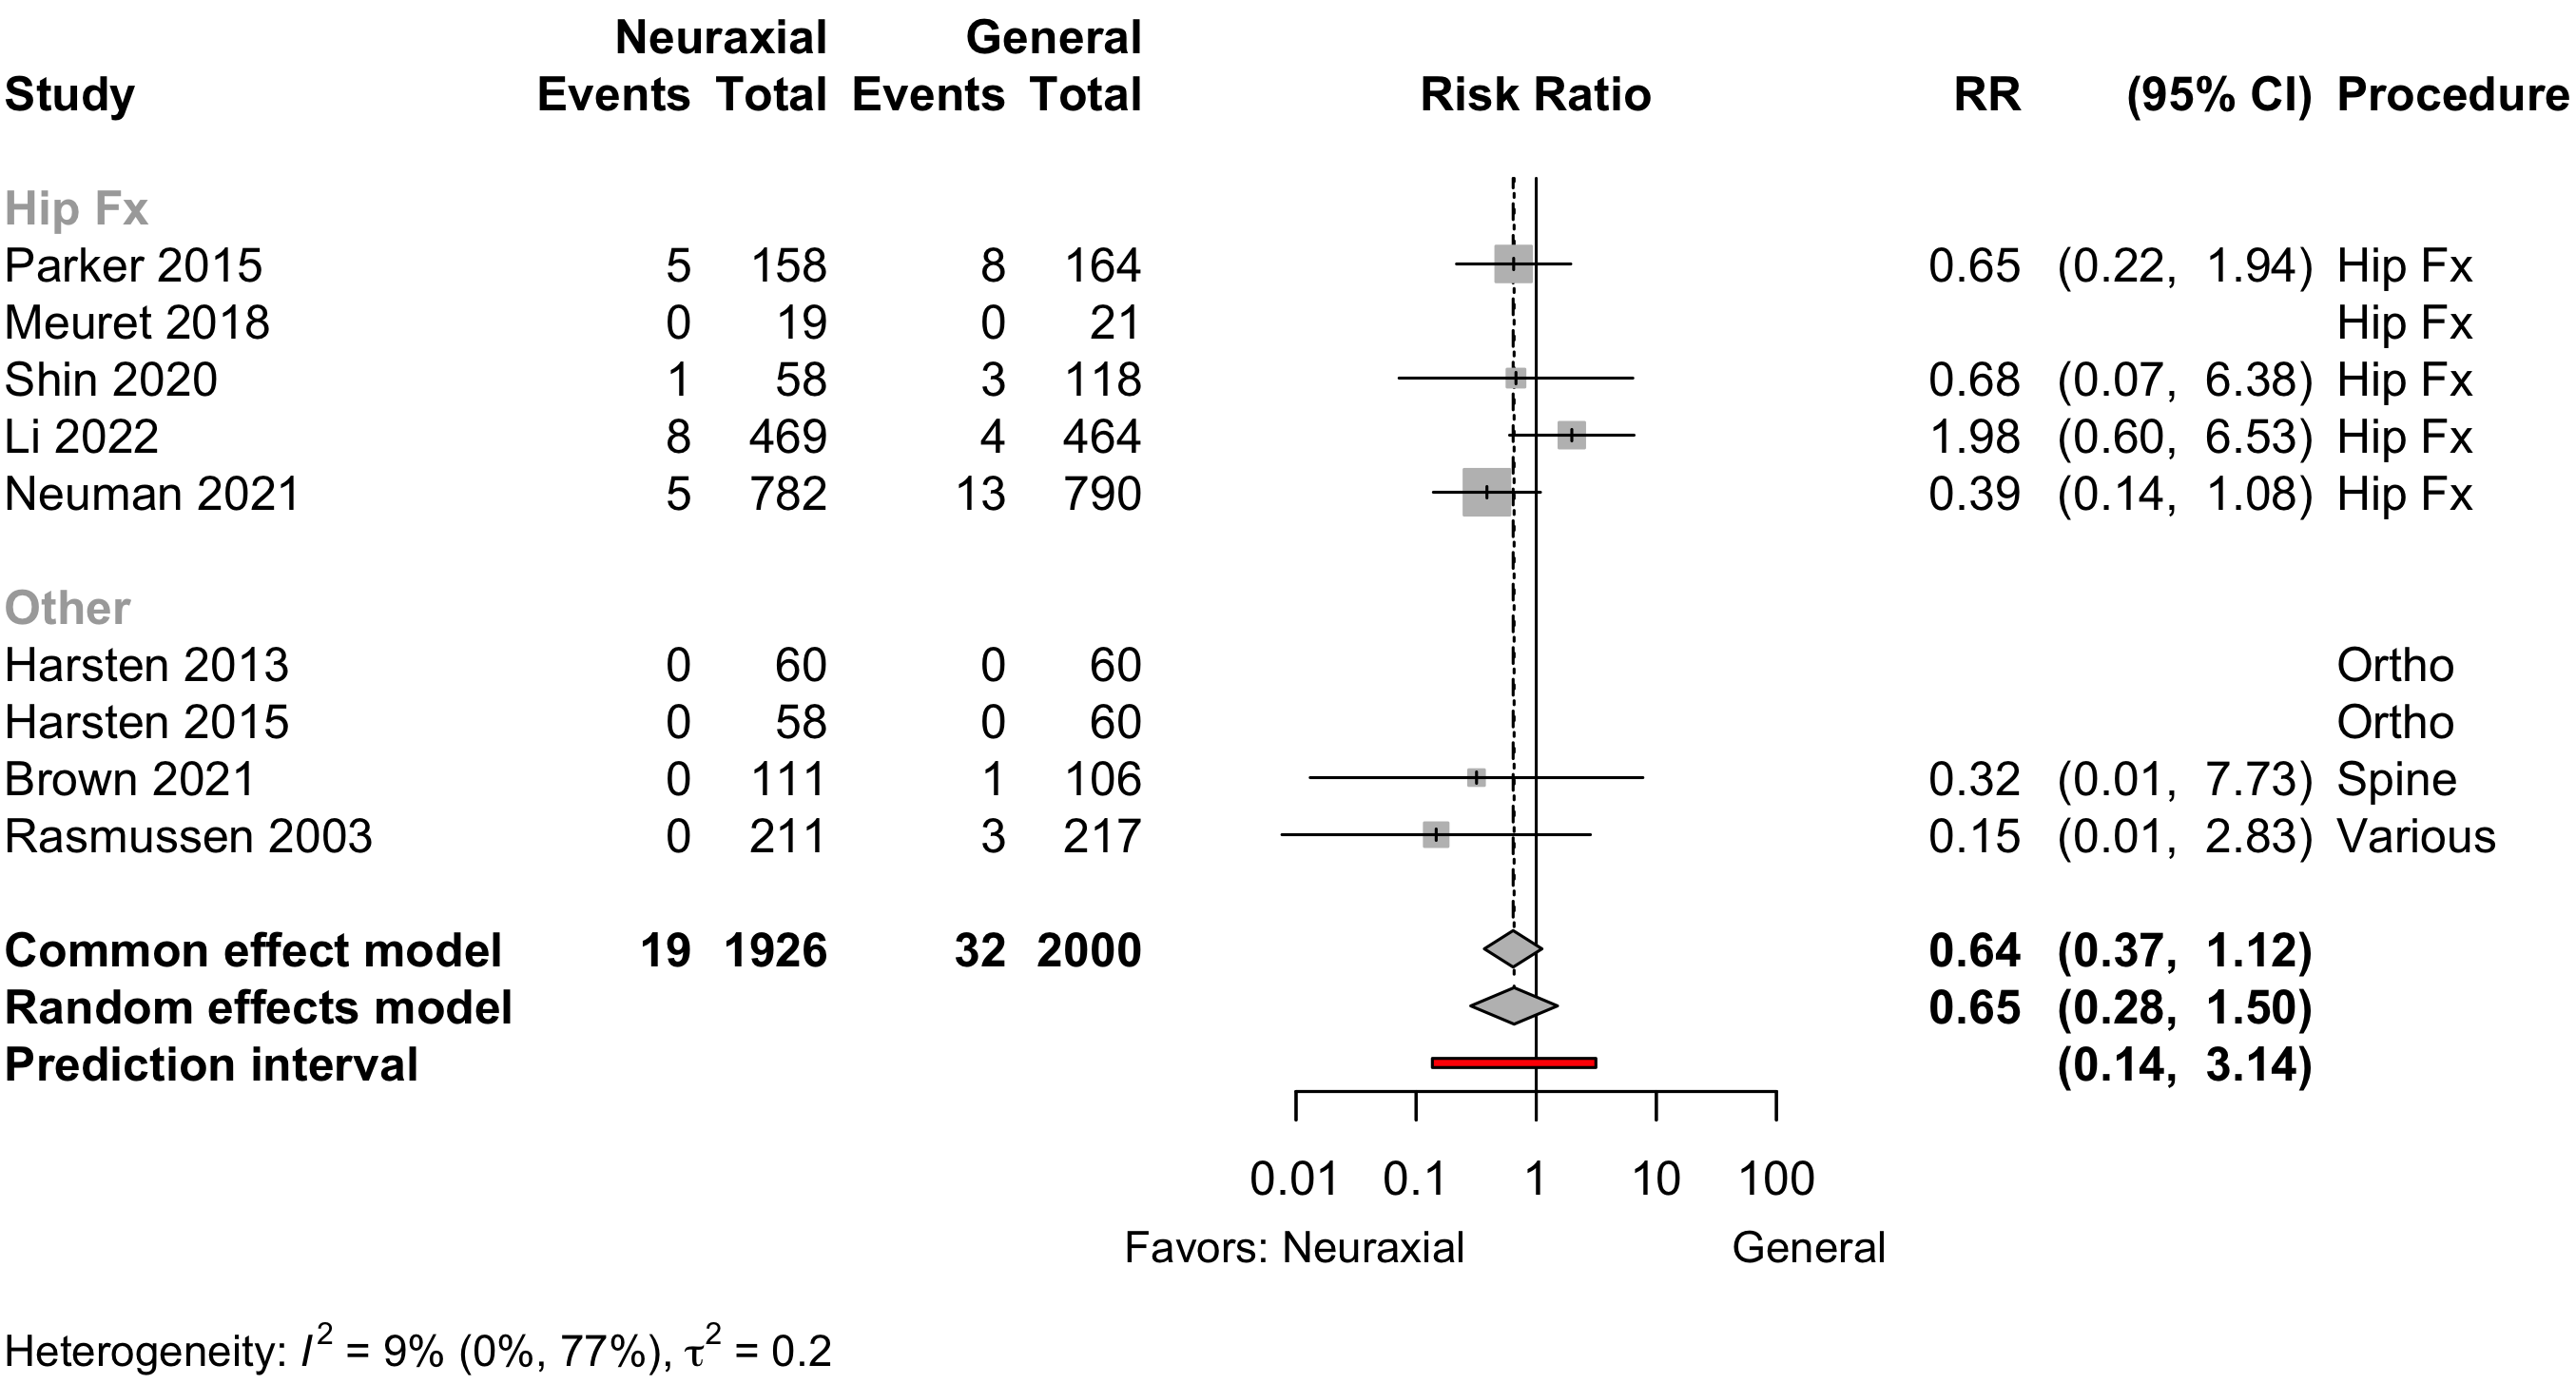
| All procedures | 6 | 19 (1,789) | 32 (1,859) | RR | 0.66 (0.28–1.50) | |
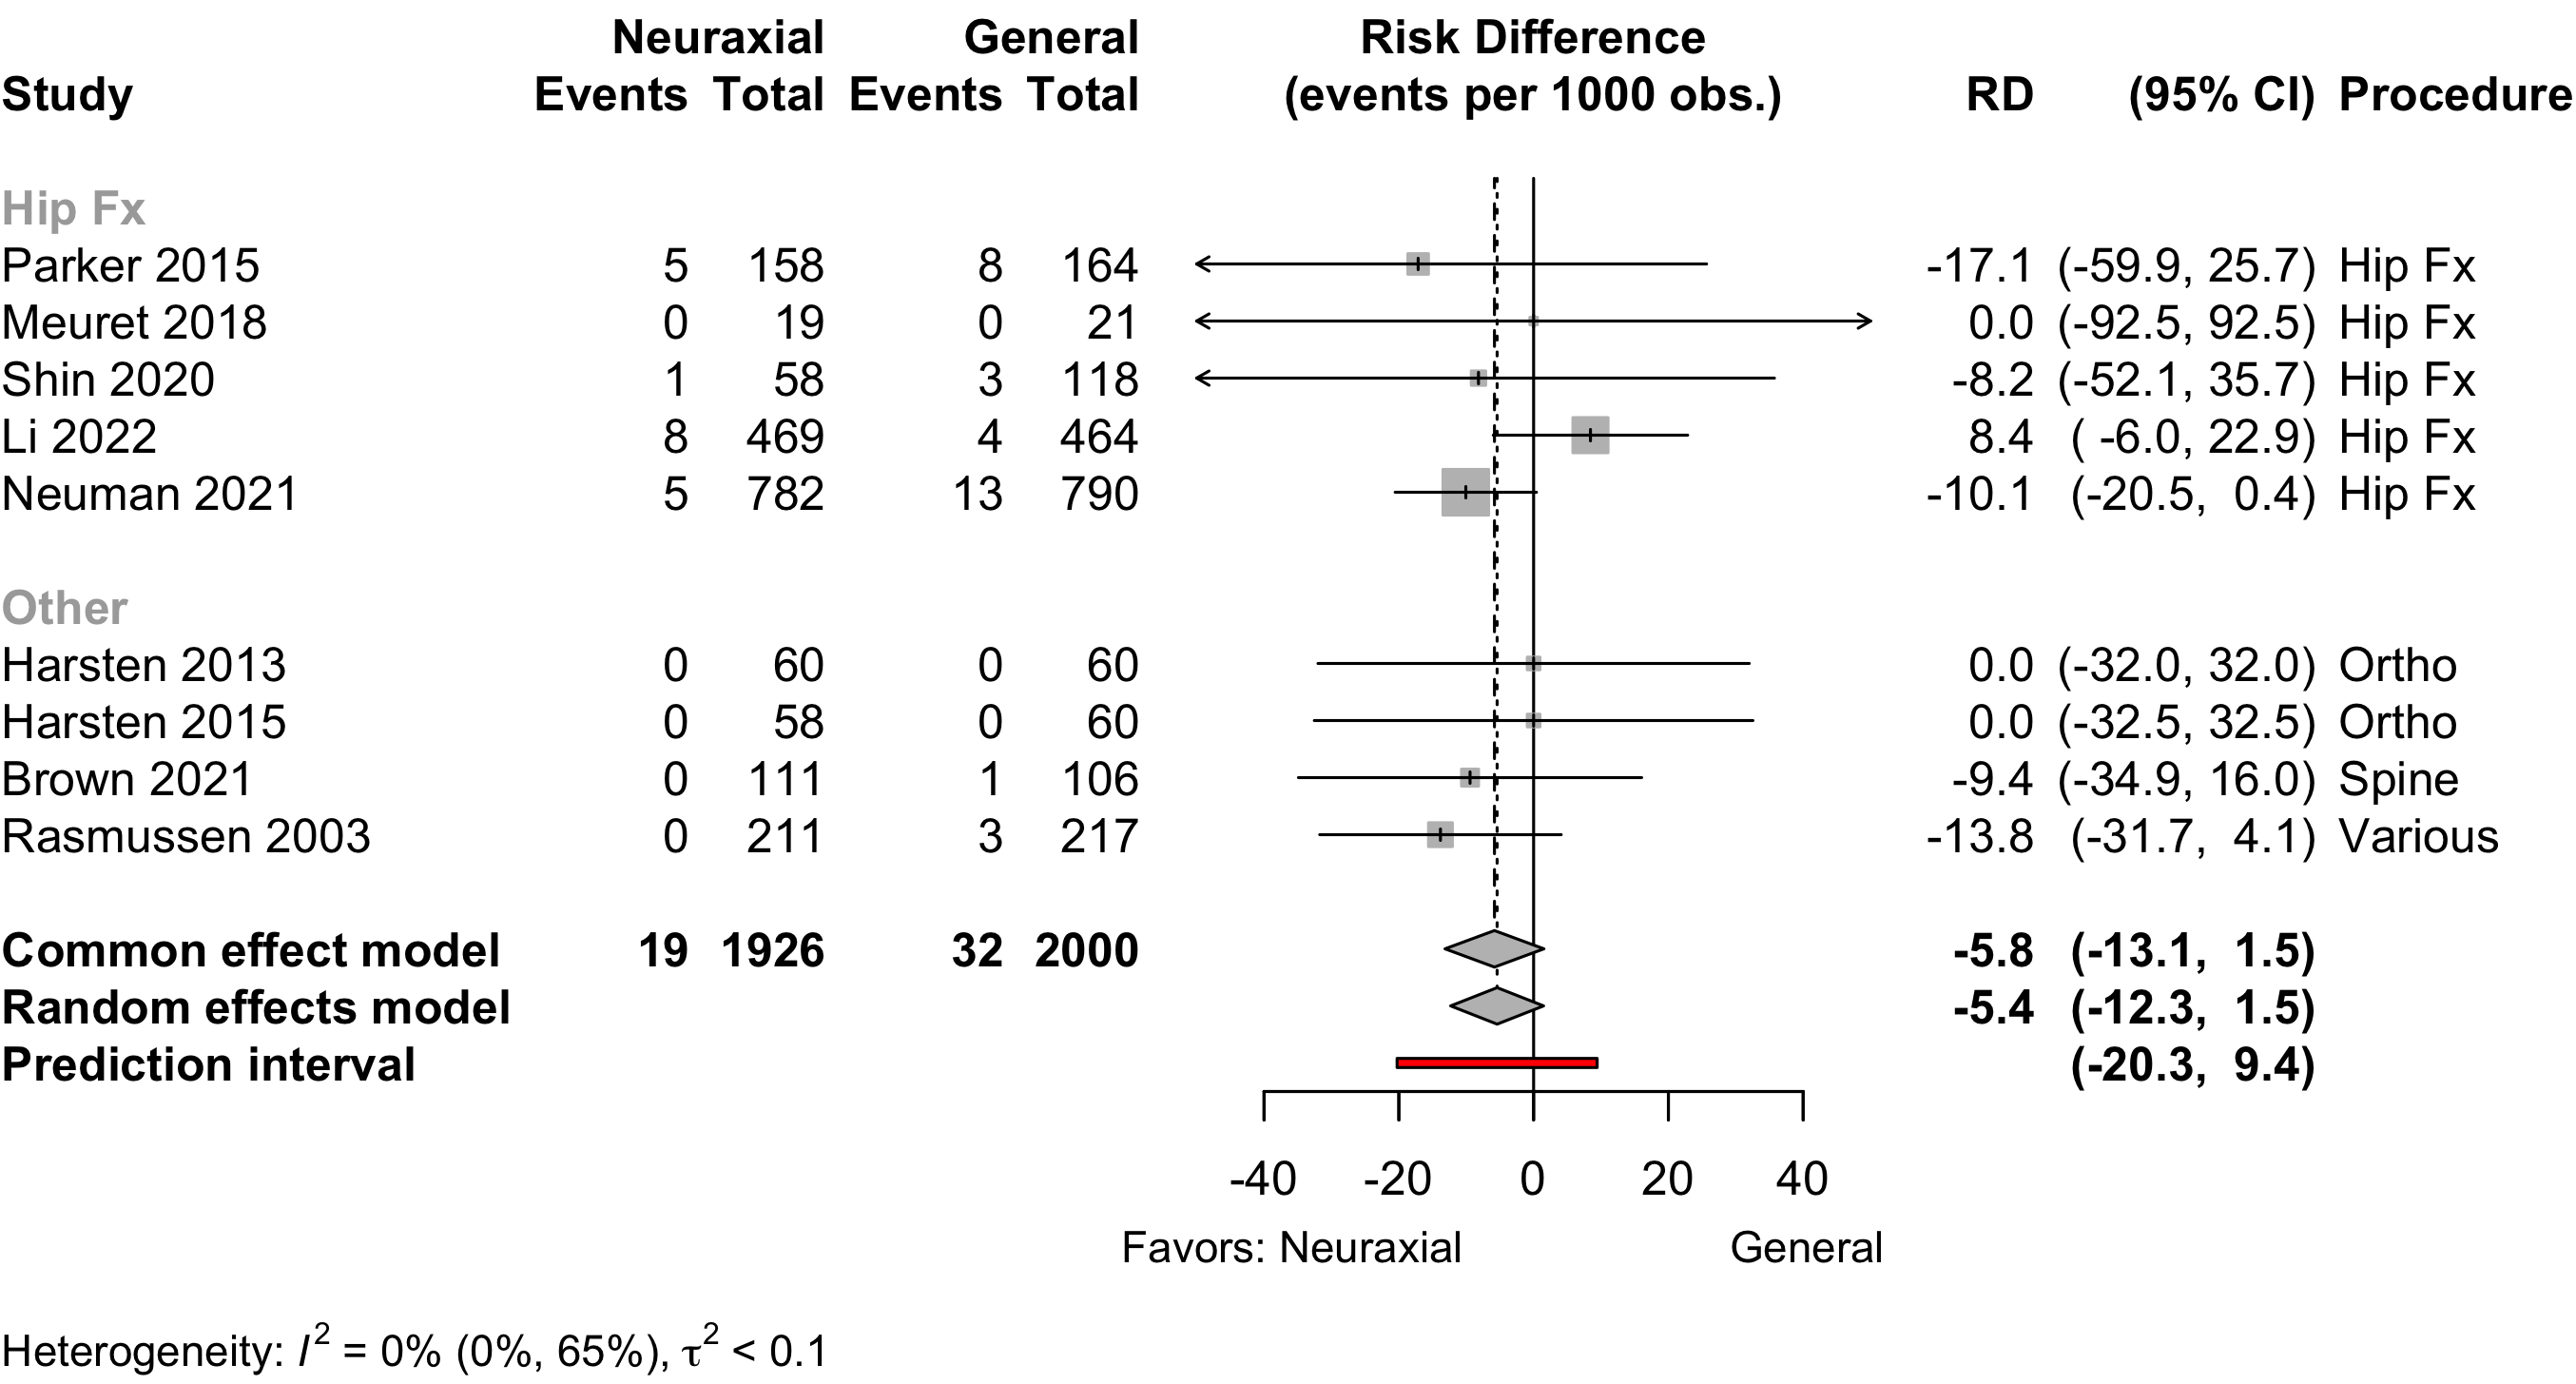
| 9 | 19 (1,926) | 31 (1,942) | RD/1000 | -5.4 (-12.3 to 1.5) | ||
| Hip fracture | 4 | 19 (1,467) | 28 (1,536) | — |
RR | 0.75 (0.34–1.64) |
| 5 | 19 (1,486) | 27 (1,557) | RD/1000 | -3.6 (-16.6 to 9.5) | ||
| Other | 2 | 19 (322) | 31 (323) | — |
RR | 0.20 (0.02–1.71)‡‡ |
| 4 | 0 (440) | 4 (443) | RD/1000 | -8.8 (-21.1 to 3.6) | ||
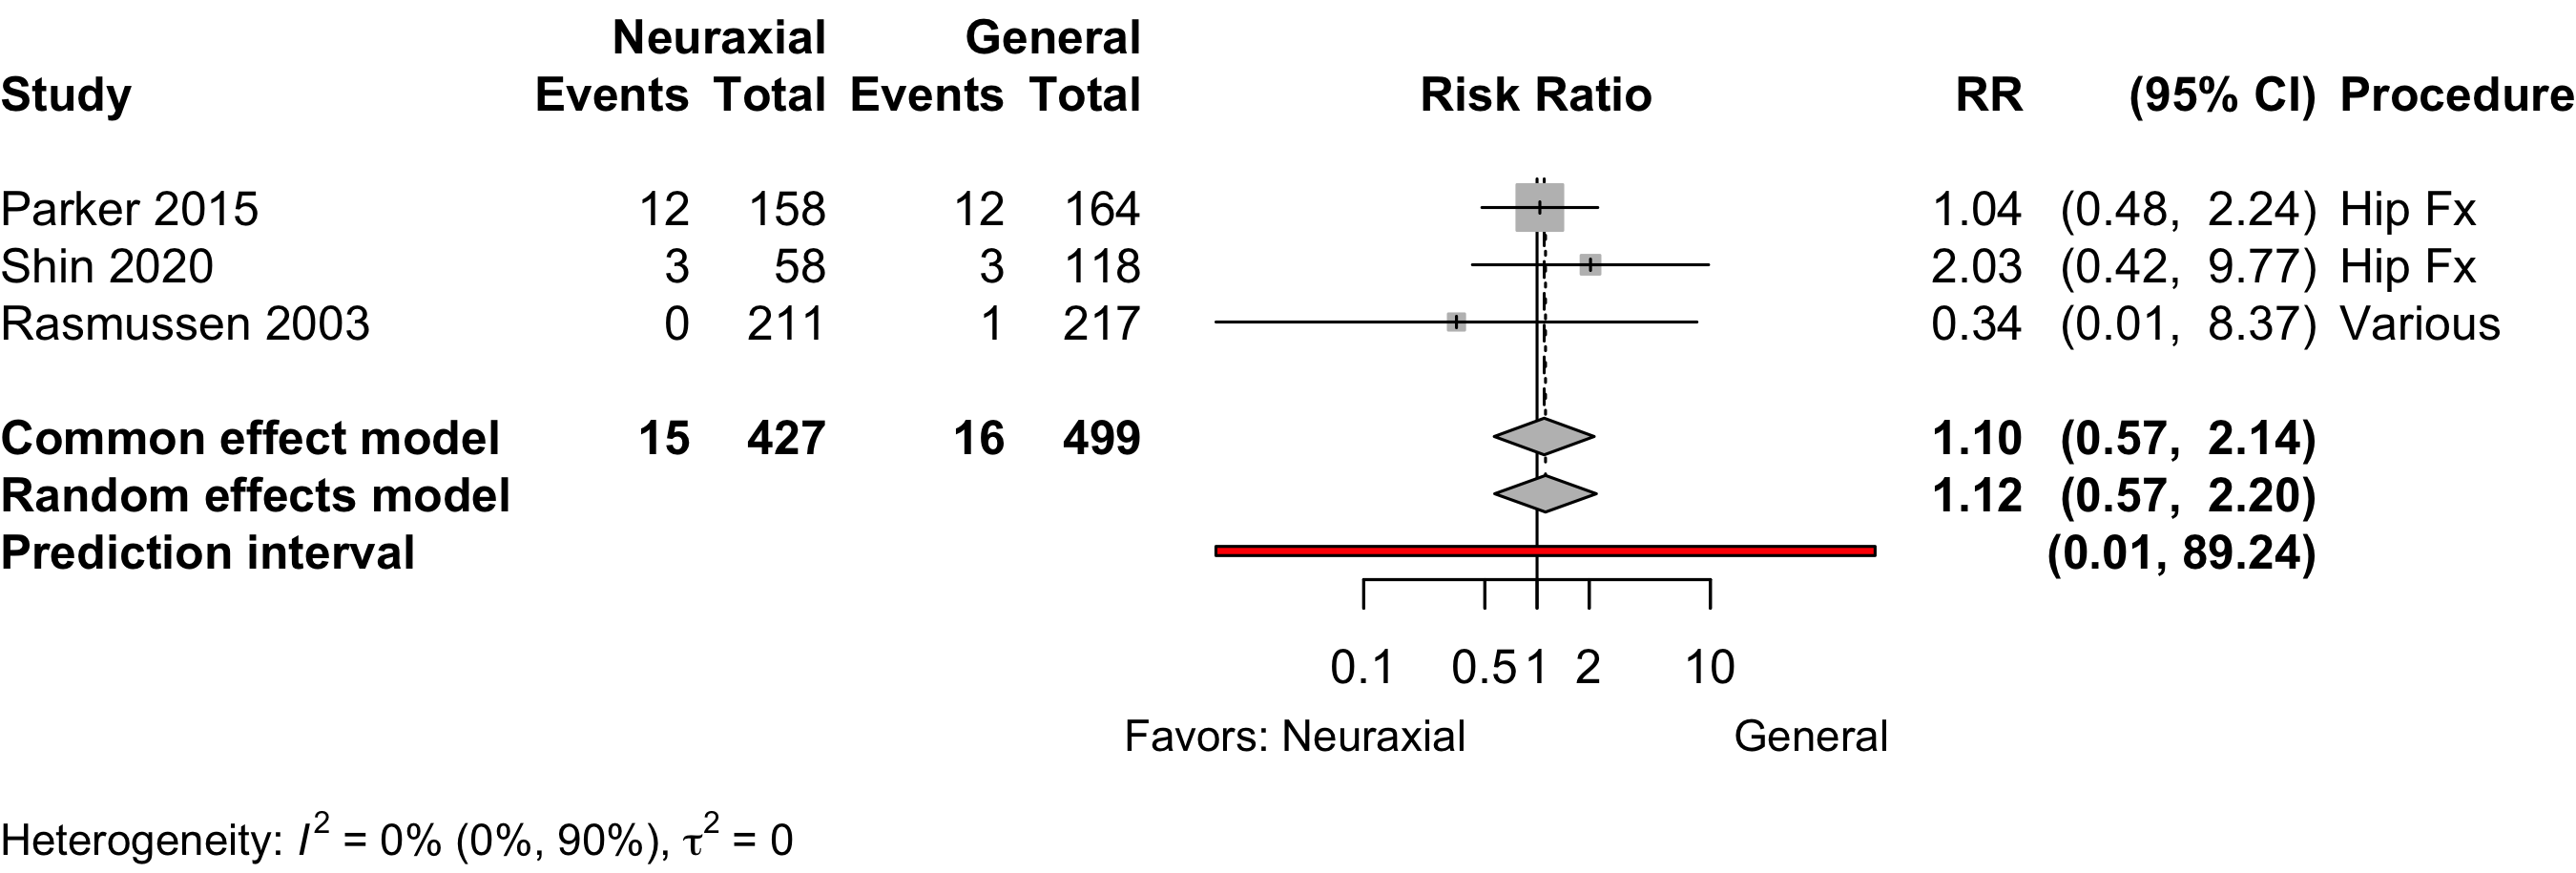
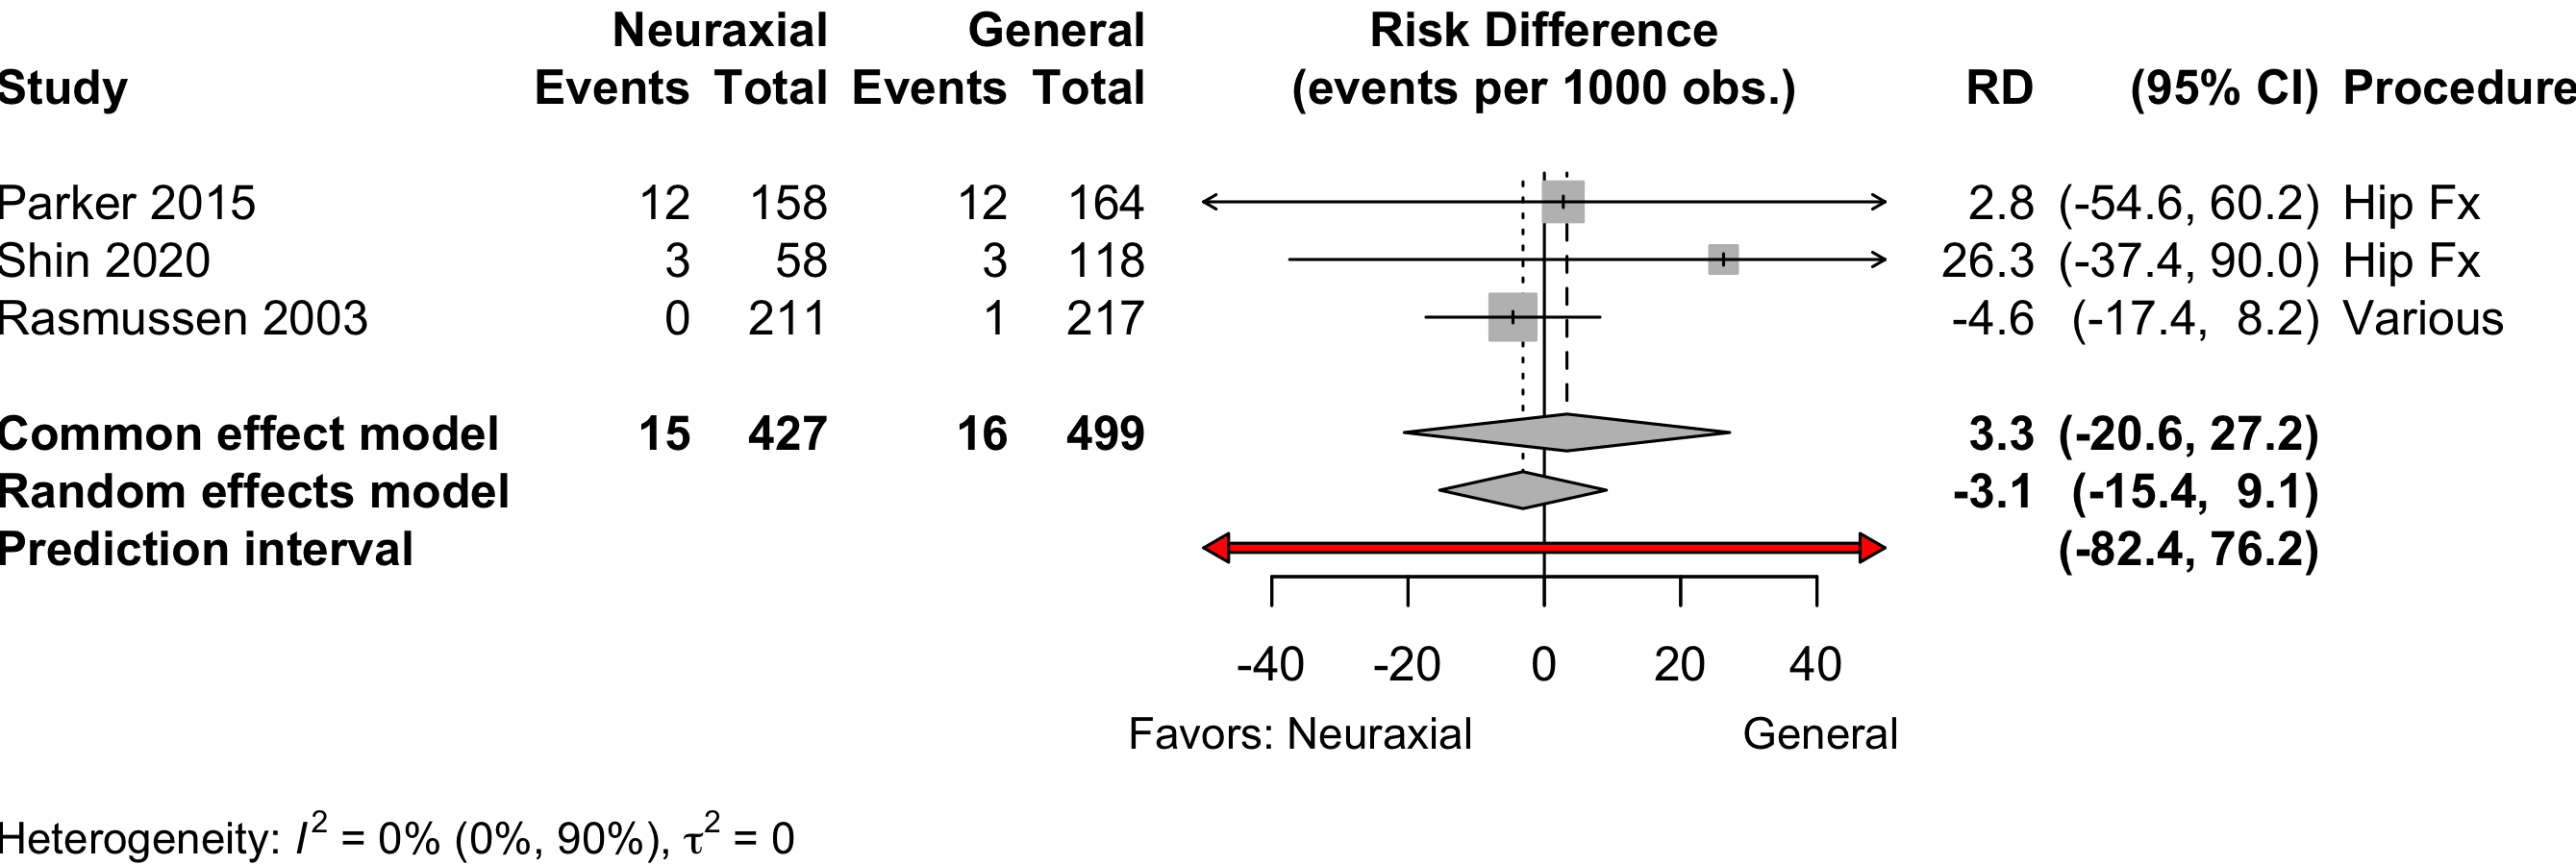
| Mortality (90-day) | 3 | 15 (427) | 16 (499) | RR | 1.12 (0.57–2.20) | |
| 3 | 15 (427) | 16 (499) | RD/1000 | -3.1 (-15.4 to 9.1) | ||
| RCT: randomized clinical trial; GRADE: Grades of Recommendation, Assessment, Development, and Evaluation; RR: risk ratio; SMD: standardized mean difference; MD: mean difference; RD/1000: risk difference per 1000. | ||||||
| * Very low: ⨁◯◯◯; Low: ⨁⨁◯◯; Moderate: ⨁⨁⨁◯; High: ⨁⨁⨁⨁. | ||||||
| † Hip fracture trials (n = 6) RR 1.08 (95% CI, 0.87–1.35); other procedures (n = 4) RR 0.74 (95% CI, 0.35–1.57). | ||||||
| ‡ RD per 100 for all surgeries 0.1 (-1.8 to 2.2); in hip fracture trials 1.3 (-1.3 to 3.9); others -2.2 (-9.2 to 4.8). | ||||||
| § Using Neuman 2021 primary result of inability to walk 60 feet without human assistance in a sensitivity analysis including 1644 patients yield a pooled SMD -0.07 (95% CI, -0.25 to 0.12). | ||||||
| ** Complications reported variously across the 13 trials. | ||||||
| †† Comparing higher/highest category or categories with lower ones. | ||||||
| ‡‡ Common effects model (2 trials). | ||||||
Neuraxial versus General Anesthesia
Key Question
Among older patients undergoing surgery and anesthesia, does neuraxial anesthesia as the primary anesthetic approach improve postoperative outcomes compared with general anesthesia?
Balance Tables
Benefits, harms, and strength of evidence (GRADE) for neuraxial versus general anesthesia.
Included complications and strength of evidence (GRADE) for neuraxial versus general anesthesia.
| Outcome | RCT | Neuraxial | General | GRADE* | Effect† | Estimate (95% CI) |
|---|---|---|---|---|---|---|
| N (Total) | N (Total) | |||||
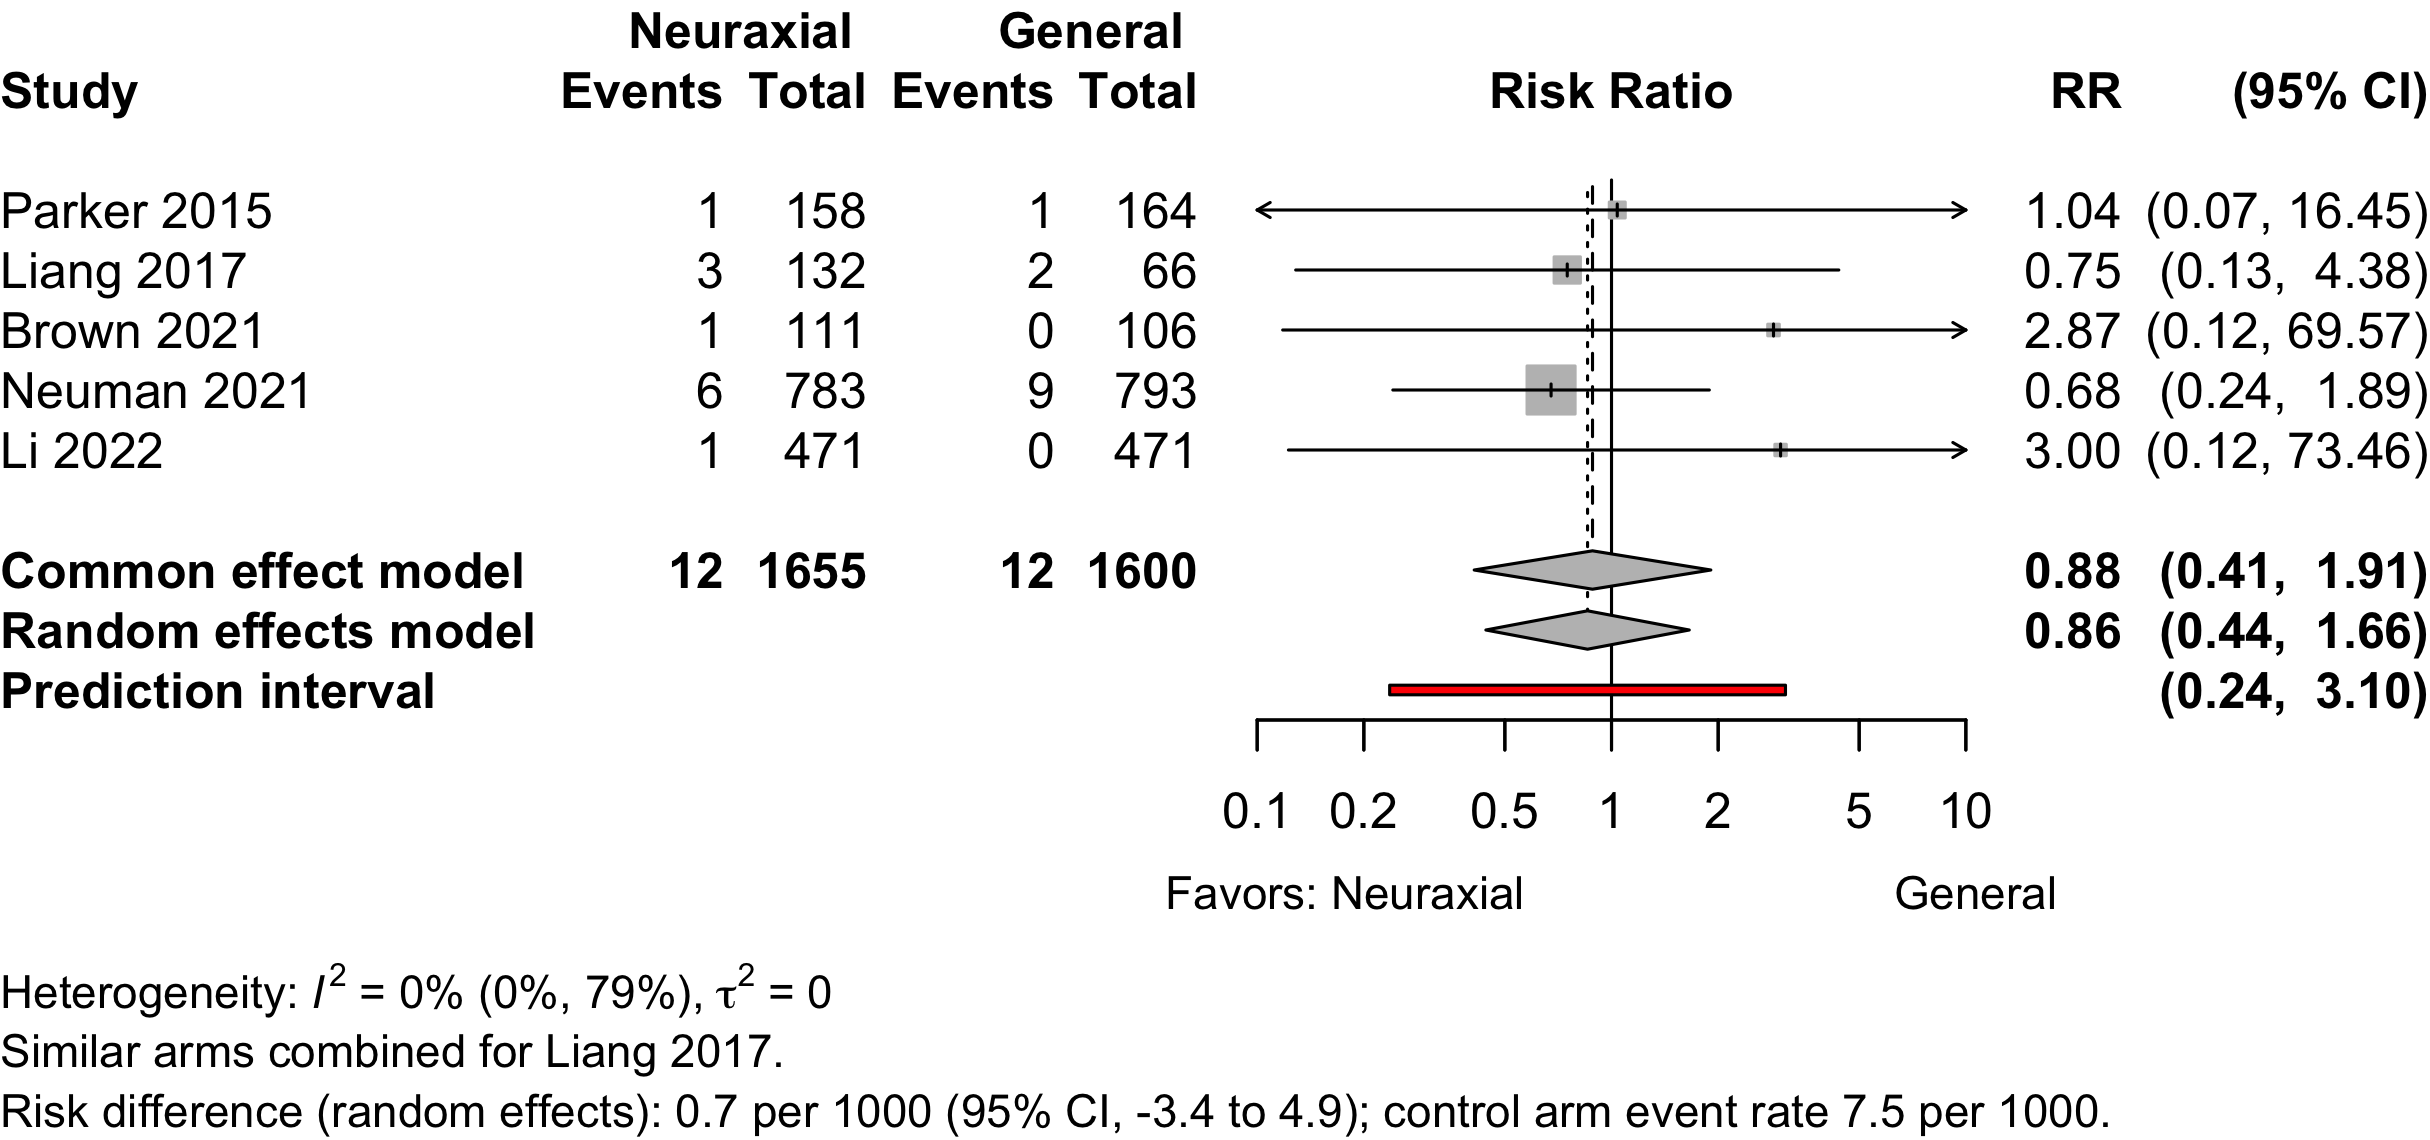
| Myocardial infarction | 5 | 12 (1,655) | 12 (1,600) | RR | 0.86 (0.44–1.66) | |
| RD/1000 | 0.7 (-3.4 to 4.9) | |||||
| Cardiac arrest | 1 | 2 (783) | 0 (793) | RD/1000 | 2.6 (-2.2 to 6.7) | |
| Bradycardia | 3 | 6 (67) | 4 (67) | RR | 1.33 (0.14–13.0) | |
| 4 | 6 (107) | 4 (107) | RD/1000 | 10.4 (-39.7 to 60.6) | ||
| Stroke | 3 | 7 (1,365) | 8 (1,370) | RR | 0.83 (0.30–2.28) | |
| RD/1000 | -1.6 (-6.8 to 3.5) | |||||
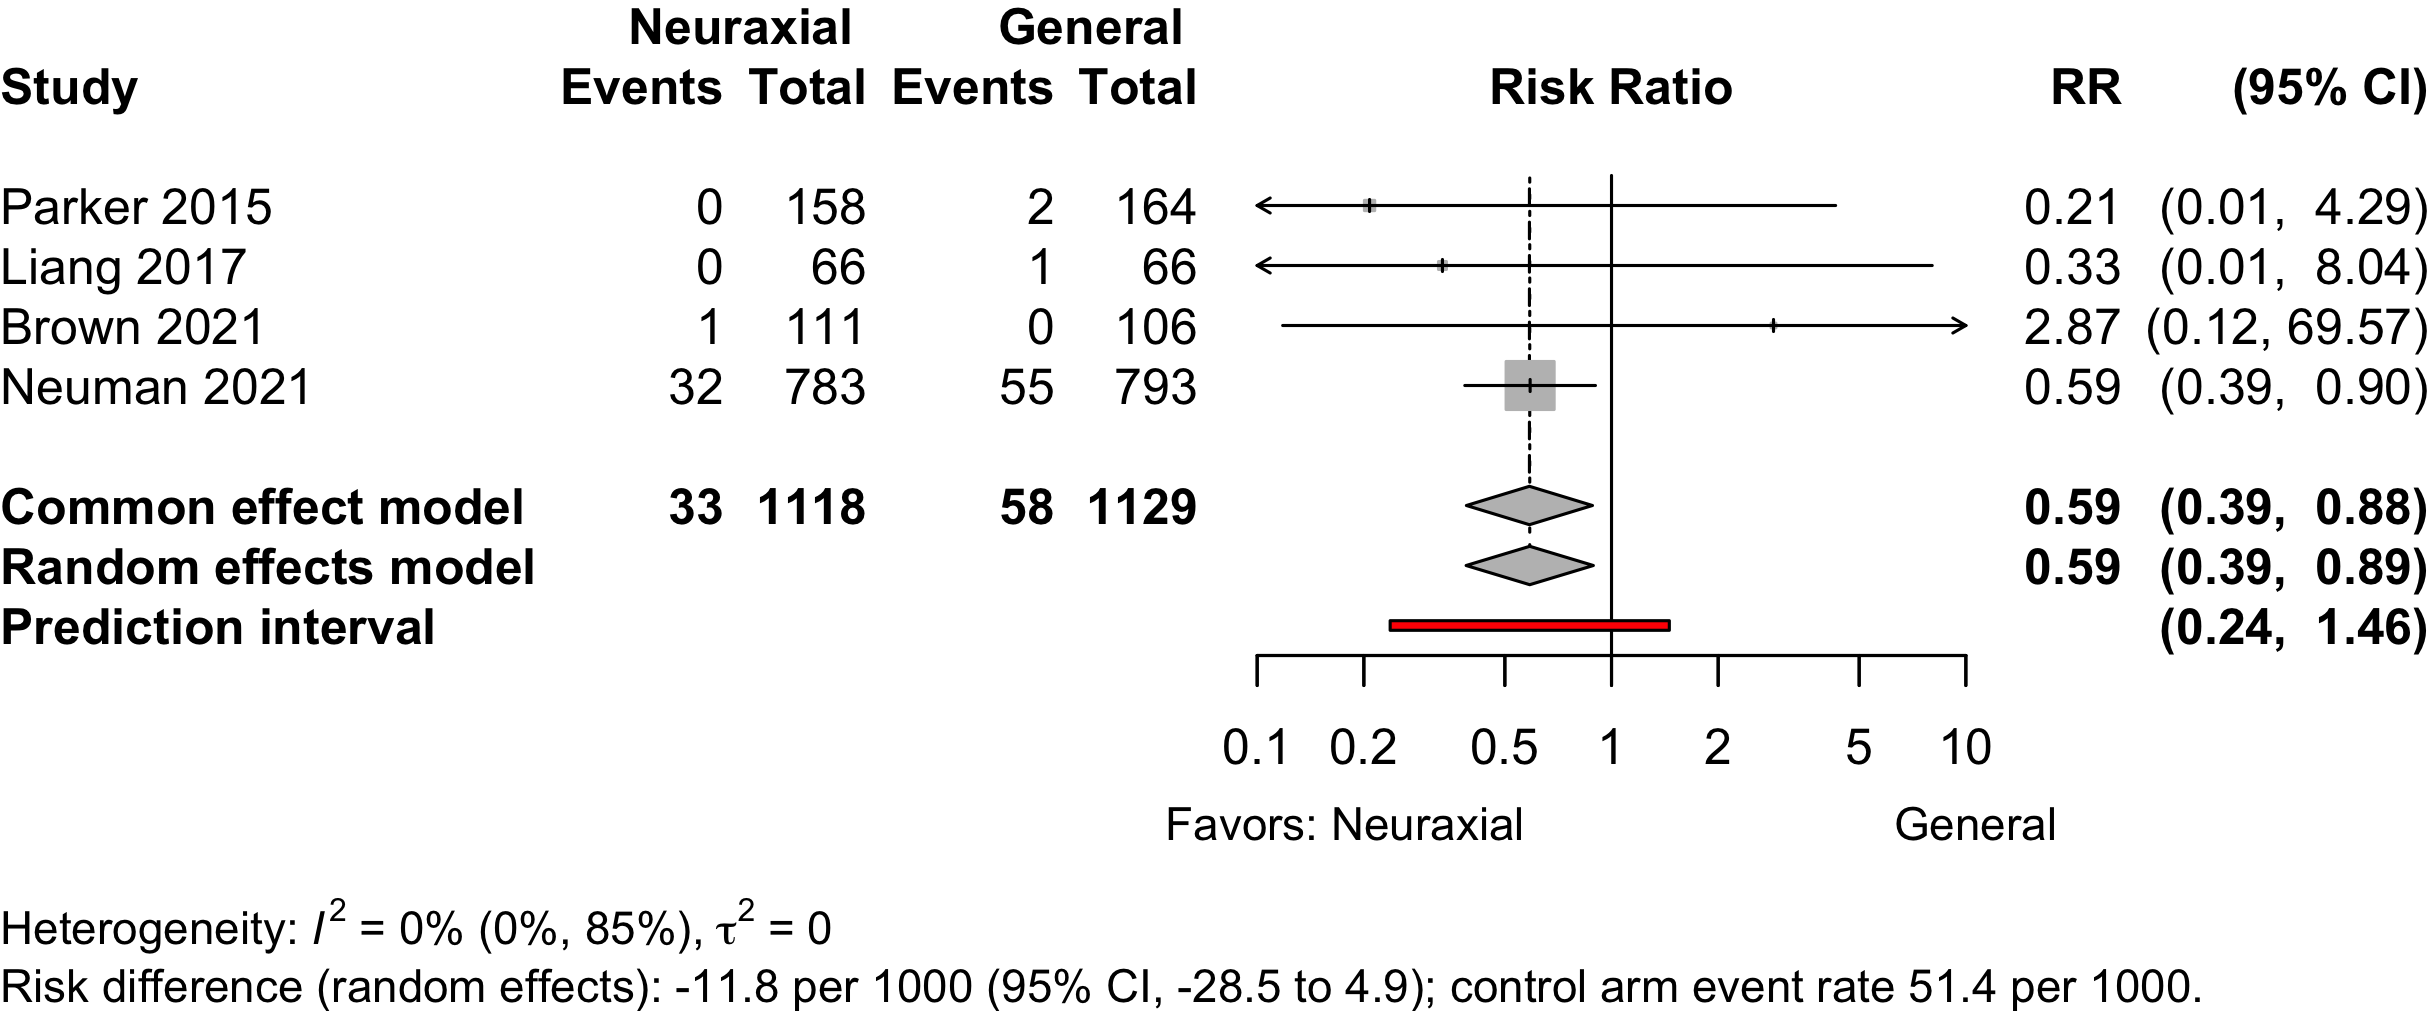
| Acute Kidney Injury | 4 | 33 (1,118) | 58 (1,129) | RR | 0.59 (0.39–0.89) | |
| RD/1000 | -21.7 (-38.1 to -5.3) | |||||
| Pulmonary complications‡ | 1 | 5 (58) | 9 (118) | RR | 0.90 (0.29–2.81) | |
| RD/1000 | -7.4 (-88.2 to 73.6) | |||||
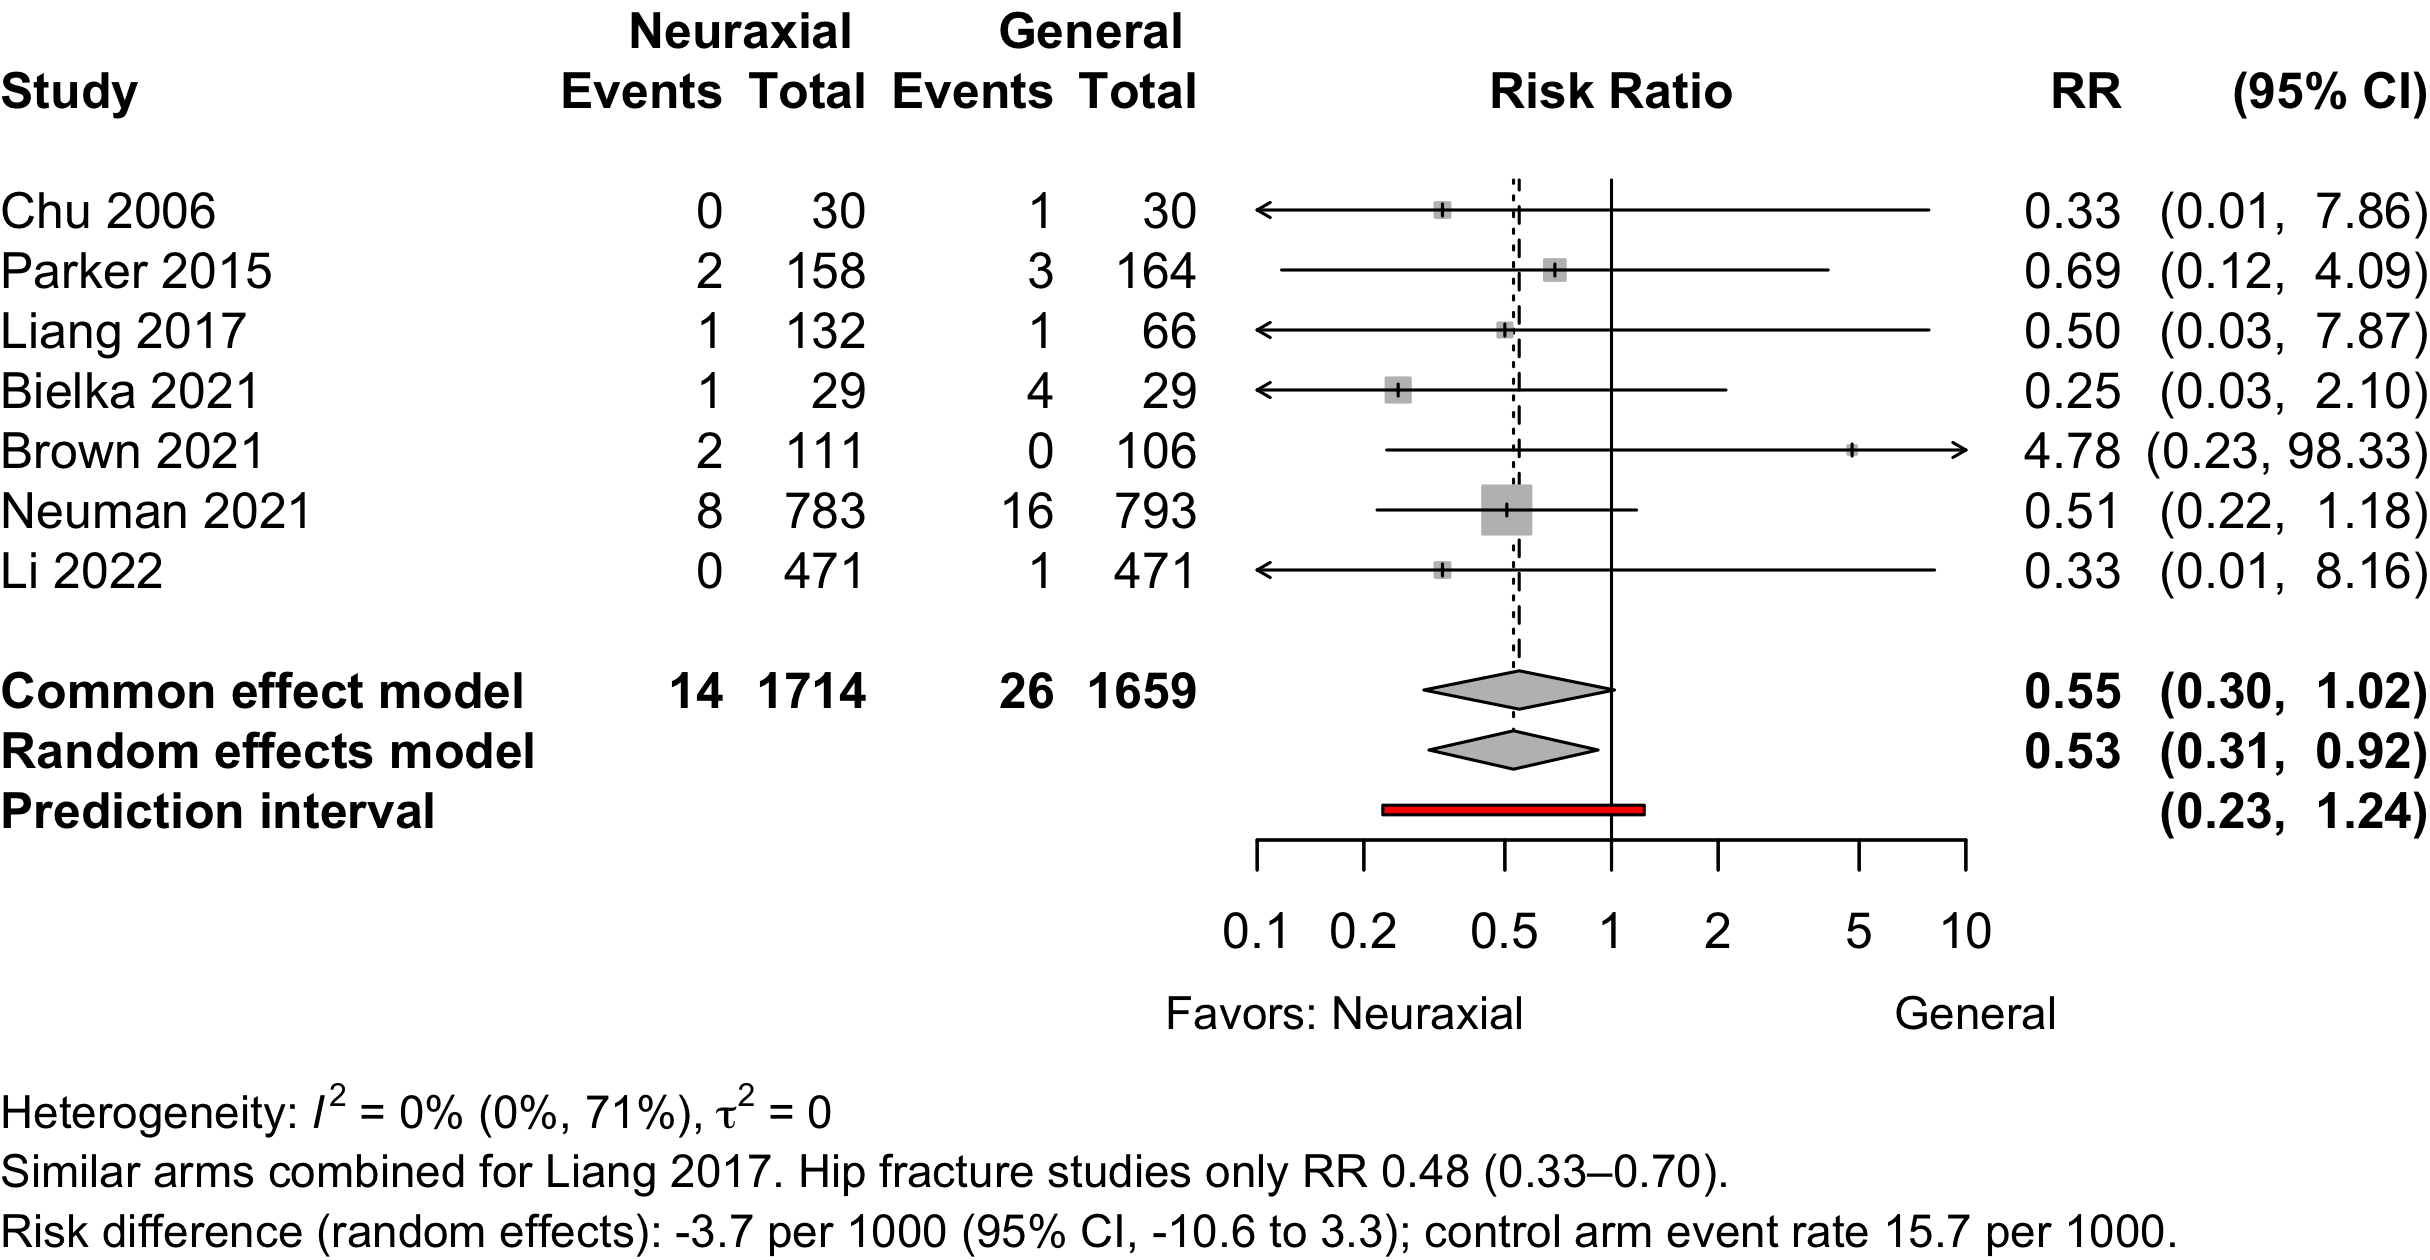
| Pneumonia | 7 | 14 (1,714) | 26 (1,659) | RR | 0.53 (0.31–0.92) | |
| RD/1000 | -7.4 (-15.0 to 0.1) | |||||
| Pulmonary congestion | 1 | 9 (783) | 8 (793) | RR | 1.14 (0.44–2.94) | |
| RD/1000 | 1.4 (-8.8 to 11.6) | |||||
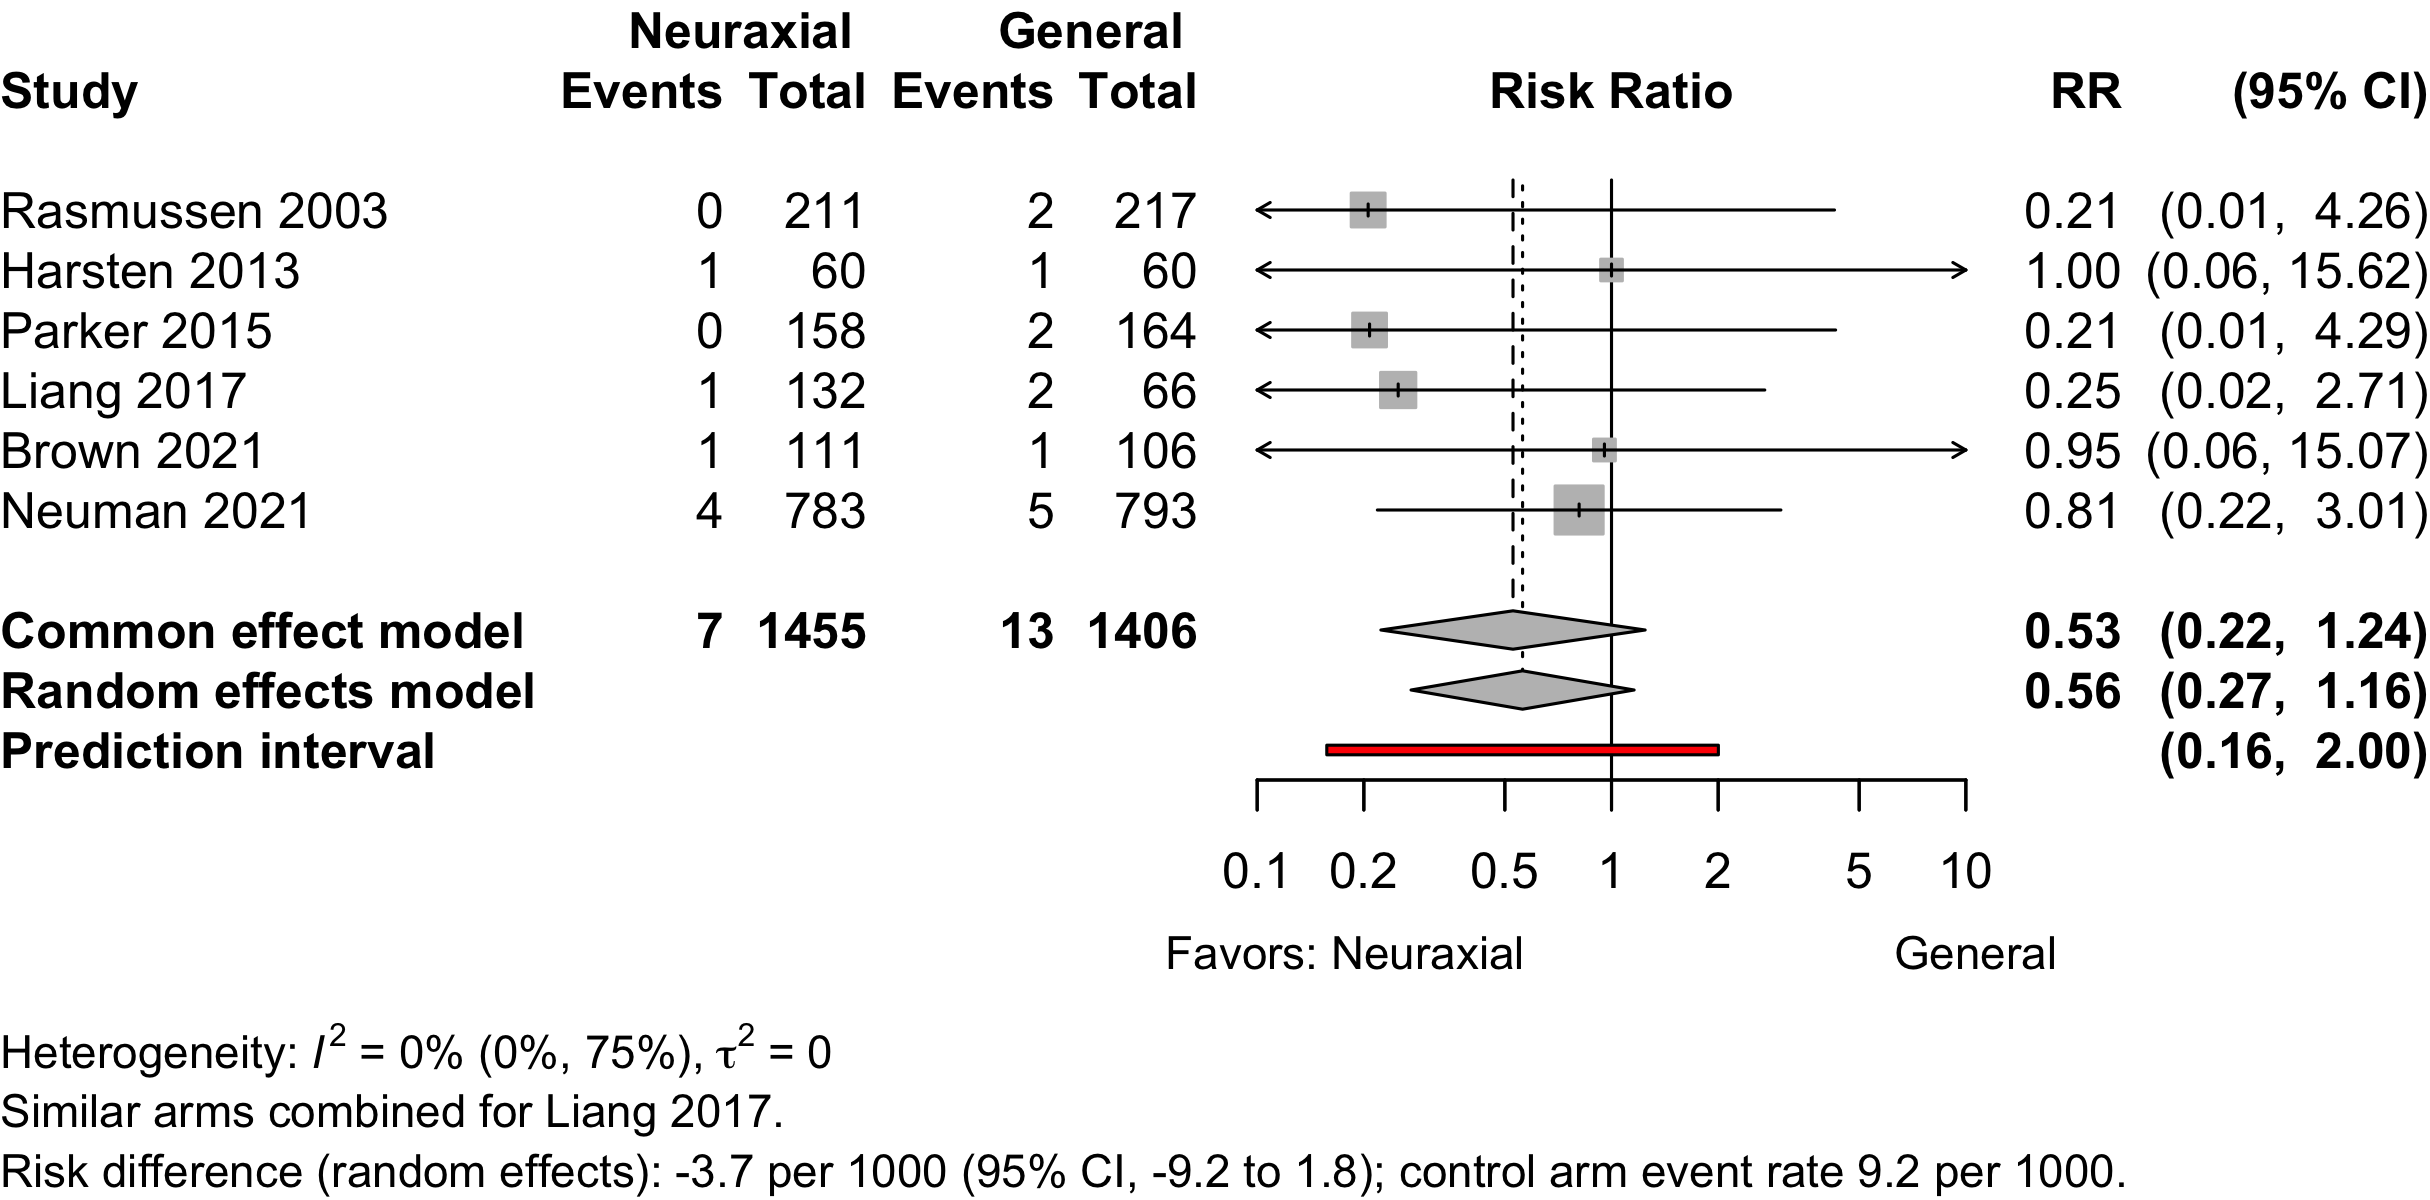
| Pulmonary embolism | 6 | 7 (1,455) | 13 (1,406) | RR | 0.56 (0.27–1.16) | |
| RD/1000 | -4.9 (-11.4 to 1.7) | |||||
| Reintubation | 1 | 4 (783) | 7 (793) | RR | 0.37 (0.17–1.97) | |
| RD/1000 | -3.7 (-11.9 to 4.5) | |||||
| RCT: randomized clinical trial; GRADE: Grades of Recommendation, Assessment, Development, and Evaluation; AKI: acute kidney injury; RR: risk ratio; RD/1000: risk difference per 1000. | ||||||
| * Very low: ⨁◯◯◯; Low: ⨁⨁◯◯; Moderate: ⨁⨁⨁◯; High: ⨁⨁⨁⨁. | ||||||
| † Fixed/common effects models when 2 studies. | ||||||
| ‡ Complications reported included pneumonia, respiratory failure, or unspecified. | ||||||
Outcomes Reported
| Outcome | RCT, N = 39a |
|---|---|
| ADL | 3 (7.7%) |
| Complications | 18 (46%) |
| DNCR/POCD | 5 (13%) |
| Delirium | 11 (28%) |
| Delirium duration | — |
| Discharge location | 2 (5.1%) |
| Mortality | 9 (23%) |
| Opioid use | 1 (2.6%) |
| Pain | 4 (10%) |
| QoR | — |
| Readmission | 2 (5.1%) |
| Satisfaction | 10 (26%) |
| ADL: activities of daily living; DNCR: delayed neurocognitive recovery; PND: postoperative neurocognitive disorder; QoR: quality of recovery; RCT: randomized clinical trial. | |
| a Number of publications, not unique trials (see inlcuded studies below). | |
| Outcome | RCT, N = 39a |
|---|---|
| Delirium duration | 1 (2.6%) |
| Length of stay | 12 (31%) |
| Opioid use | 7 (18%) |
| RCT: randomized clinical trial. | |
| a Number of publications, not unique trials (see inlcuded studies below). | |
| Outcome | RCT, N = 39a |
|---|---|
| ADL | 3 (7.7%) |
| DNCR/POCD | 10 (26%) |
| Delirium | 1 (2.6%) |
| Complications | 1 (2.6%) |
| Pain | 16 (41%) |
| Quality of life | 1 (2.6%) |
| QoR | 1 (2.6%) |
| Satisfaction | 1 (2.6%) |
| ADL: activities of daily living; DNCR: delayed neurocognitive recovery; PND: postoperative neurocognitive disorder; QoR: quality of recovery; RCT: randomized clinical trial. | |
| a Number of publications, not unique trials (see inlcuded studies below). | |
Included Studies
See Appendix for detailed summary study and patient characteristics including primary outcomes.
| Design | Studies |
|---|---|
| Randomized Clinical Trial | 37 |
| Total | 37 |
| One trial with three publications counted once. | |
Design, centers, country, and surgery
| ID | Study | Centers | Enrolled | Country | Surgery |
|---|---|---|---|---|---|
| 4782 | 1 | 198 | Chinaa | Hip fracture | |
| 13141 | 1 | 281 | Chinaa | Hip fracture | |
| 7490 | 9 | 950 | China | Hip fracture | |
| 6072 | 1 | 40 | France | Hip fracture | |
| 1320 | 1 | 72 | Greece | Hip fracture | |
| 13669 | 1 | 100 | Irana | Hip fracture | |
| 14441 | 1 | 30 | Italy | Hip fracture | |
| 6109 | 1 | 186 | South Korea | Hip fracture | |
| 1335 | 1 | 322 | UK | Hip fracture | |
| 8117 | 46 | 1600 | USA | Hip fracture | |
| 17100 | 46 | 1600 | USA | Hip fracture | |
| 18678 | 46 | 1600 | USA | Hip fracture | |
| 6540 | 1 | 90 | Ukrainea | Hip fracture | |
| 14566 | 1 | 60 | Chinaa | Ortho | |
| 1489 | 1 | 80 | Chinaa | Ortho | |
| 2020 | 1 | 25 | Chinaa | Ortho | |
| 158 | 1 | 240 | Chinaa | Ortho | |
| 5894 | 1 | 60 | Indiaa | Ortho | |
| 17971 | 1 | 210 | Malta | Ortho | |
| 208 | 1 | 124 | Sweden | Ortho | |
| 269 | 1 | 120 | Sweden | Ortho | |
| 2252 | 1 | 80 | Turkey | Ortho | |
| 781 | 1 | 98 | Australia | Urol | |
| 296 | 1 | 72 | Italy | Urol | |
| 329 | 1 | 121 | Italy | Urol | |
| 397 | 1 | 80 | Japan | Urol | |
| 737 | 1 | 60 | Turkeya | Urol | |
| 3218 | 1 | 61 | USA | Urol | |
| 16573 | 1 | 240 | Chinaa | GI/Abdominal | |
| 6132 | 1 | 206 | Chinaa | GI/Abdominal | |
| 658 | 1 | 54 | Thailand | GI/Abdominal | |
| 241 | 1 | 57 | Croatia | Neuro | |
| 15278 | 1 | 52 | Turkey | Neuro | |
| 262 | 1 | 60 | UK | Gyn | |
| 1400 | 1 | 50 | Greece | Gyn|Ortho|Urol|Vasc | |
| 7554 | 1 | 219 | USA | Spine | |
| 307 | 1 | 40 | Croatia | Vasc | |
| 831 | 12 | 428 | Denmark | Variousb | |
| 239 | 1 | 40 | Italy | Otherc | |
| GI: gastrointestinal; Ortho: orthopedic; Urol: urological; Neuro: neurological; Vasc: vascular; Various: described as various/mixed or more than 4 different tyeps of procedures. | |||||
| a Non very-high Human Development Index country. | |||||
| b Described as various or more than 4 different types of surgery. | |||||
| c Loco-regional antiblastic perfusion with circulatory block. | |||||
Country Summary
| N = 37a | |
|---|---|
| Country | |
| China | 9 (24%) |
| Italy | 4 (11%) |
| Turkey | 3 (8.1%) |
| USA | 3 (8.1%) |
| Croatia | 2 (5.4%) |
| Greece | 2 (5.4%) |
| Sweden | 2 (5.4%) |
| UK | 2 (5.4%) |
| Australia | 1 (2.7%) |
| Denmark | 1 (2.7%) |
| France | 1 (2.7%) |
| India | 1 (2.7%) |
| Iran | 1 (2.7%) |
| Japan | 1 (2.7%) |
| Malta | 1 (2.7%) |
| South Korea | 1 (2.7%) |
| Thailand | 1 (2.7%) |
| Ukraine | 1 (2.7%) |
| a n (%) | |
Comparators
| Study | N | Arm | ASA | Agea | MMSEa | Dementia N (%)b |
General | Neuraxial | ||||
|---|---|---|---|---|---|---|---|---|---|---|---|---|
| PS | Vol | TIVA | NR | Spinal | Epid | CSE | ||||||
| Ortho — HipFx | ||||||||||||
| 15 | Gen | 23 | 84.0 [67-88] |
29 [24-29] |
● | |||||||
| 15 | Neur | 84.0 [71-94] |
28 [25-30] |
● | ||||||||
| 164 | Gen | 1234 | 83.0 [59-99] |
● | ||||||||
| 158 | Neur | 82.9 [25-105] |
● | |||||||||
| 50 | Gen | 123 | 66.0 (4.8) |
0 (0) | ● | |||||||
| 50 | Neur | 66.2 (5.2) |
0 (0) | ● | ||||||||
| 66 | Gen | 123 | 68.0 (11.0) |
26.7 (1.6) |
0 (0) | ● | ||||||
| 66 | Neur | 67.0 (12.0) |
26.8 (2.0) |
0 (0) | ● | |||||||
| 66 | Neur | 66.0 (10.0) |
26.6 (1.9) |
0 (0) | ● | |||||||
| 21 | Gen | 123 | 85.0 (5.0) |
21 [12-24] |
● | |||||||
| 19 | Neur | 83.0 (6.0) |
19 [12-26] |
● | ||||||||
| 33 | Gen | 123 | 75.1 (6.1) |
25.7 (2.9) |
0 (0) | ● | ||||||
| 37 | Neur | 77.1 (6.5) |
25.3 (0.9) |
0 (0) | ● | |||||||
| 60 | Gen | NR | 79.4 (7.7) |
12 (20.0) | ● | |||||||
| 58 | Gen | 80.5 (6.7) |
7 (12.1) | ● | ||||||||
| 58 | Neur | 81.6 (6.7) |
10 (17.2) | ● | ||||||||
| 30 | Gen | NR | 73.0 {72-74} |
0 (0) | ● | |||||||
| 30 | Neur | 72.0 {70-73} |
0 (0) | ● | ||||||||
| 804 | Gen | 1234 | 78.4 (10.6) |
94 (11.7) | ● | |||||||
| 795 | Neur | 77.7 (10.7) |
109 (13.7) | ● | ||||||||
| 154 | Gen | 123 | 74.1 (4.2) |
25.6 (1.4) |
0 (0) | ● | ||||||
| 127 | Neur | 73.1 (6.2) |
25.7 (1.2) |
0 (0) | ● | |||||||
| 471 | Gen | 1234 | 77.0 {71-82} |
20 {15-25} |
190 (40.3) | ● | ● | |||||
| 471 | Neur | 77.0 {72-82} |
20 {15-24} |
182 (38.6) | ● | ● | ● | |||||
| 796 | Gen | 1234 | 78.0 (11.0) |
93 (11.7) | ● | |||||||
| 785 | Neur | 78.0 (11.0) |
109 (13.9) | ● | ||||||||
| 211 | Gen | NR | 211 (100) | ● | ● | |||||||
| 225 | Neur | 225 (100) | ● | |||||||||
| 418 | Gen | NR | 0 (0) | ● | ● | |||||||
| 408 | Neur | 0 (0) | ● | |||||||||
| Ortho — HipFx|Other | ||||||||||||
| 40 | Gen | NR | 69.4 (2.6) |
0 (0) | ● | |||||||
| 40 | Neur | 69.4 (2.6) |
0 (0) | ● | ||||||||
| Ortho — TKA|THA|HipFx|Other | ||||||||||||
| 30 | Gen | 12 | 67.1 (7.1) |
27.3 (1.8) |
0 (0) | ● | ||||||
| 30 | Neur | 66.6 (5.6) |
28.0 (1.3) |
0 (0) | ● | |||||||
| Ortho — TKA | ||||||||||||
| 30 | Gen | 123 | 69.0 {62-74} |
● | ||||||||
| 30 | Neur | 65.0 {62-68} |
● | |||||||||
| 60 | Gen | 123 | 68.0 (7.0) |
● | ||||||||
| 60 | Neur | 67.0 (7.0) |
● | |||||||||
| 26 | Gen | NR | 68.8 (4.9) |
22.6 (3.0) |
0 (0) | ● | ||||||
| 31 | Neur | 69.8 (4.4) |
22.6 (2.7) |
0 (0) | ● | |||||||
| 101 | Gen | 12 | 68.0 {61-71} |
● | ● | |||||||
| 99 | Neur | 68.0 {62-70} |
● | |||||||||
| Ortho — THA | ||||||||||||
| 60 | Gen | 123 | 68.0 (9.0) |
● | ||||||||
| 58 | Neur | 66.0 (7.8) |
● | |||||||||
| 80 | Gen | NR | 75.4 (5.6) |
● | ||||||||
| 80 | Neur | 75.6 (5.5) |
● | |||||||||
| 80 | Neur | 75.0 (5.2) |
● | |||||||||
| Ortho | ||||||||||||
| 13 | Gen | NR | 58.4 (7.3) |
● | ||||||||
| 12 | Neur | 62.7 (8.7) |
● | |||||||||
| Urol | ||||||||||||
| 34 | Gen | NR | 66.0 (6.8) |
● | ||||||||
| 36 | Neur | 65.3 (6.9) |
● | |||||||||
| 34 | Gen | NR | 66.0 (7.0) |
● | ||||||||
| 30 | Neurd | 59.5 (10.4) |
● | |||||||||
| 29 | Neure | 64.1 (8.1) |
● | |||||||||
| 28 | Neurf | 65.3 (6.3) |
● | |||||||||
| 40 | Gen | 12 | 73.0 (6.0) |
0 (0) | ● | |||||||
| 40 | Neur | 71.0 (6.0) |
0 (0) | ● | ||||||||
| 30 | Gen | 23 | 70.0 (9.6) |
● | ||||||||
| 30 | Neur | 76.4 (11.8) |
● | |||||||||
| 50 | Gen | NR | 63.9 [55-78] |
0 (0) | ● | |||||||
| 48 | Neur | 66.9 [56-75] |
0 (0) | ● | ||||||||
| 29 | Gen | NR | 63.7 (11.4) |
● | ||||||||
| 29 | Neur | 67.3 (10.9) |
● | |||||||||
| GI/Abdominal | ||||||||||||
| 116 | Gen | NR | 74.8 (4.0) |
0 (0) | ● | |||||||
| 117 | Neur | 75.7 (4.2) |
0 (0) | ● | ||||||||
| 103 | Gen | NR | 71.9 (8.4) |
● | ||||||||
| 103 | Neur | 71.2 (7.9) |
● | |||||||||
| 18 | Gen | 123 | 67.7 (15.1) |
● | ||||||||
| 18 | Neur | 64.9 (10.3) |
● | |||||||||
| Neuro | ||||||||||||
| 28 | Gen | NR | 66.0 (8.7) |
● | ||||||||
| 29 | Neur | 66.2 (8.3) |
● | |||||||||
| 25 | Gen | 123 | 62.7 (14.3) |
0 (0) | ● | |||||||
| 25 | Neur | 67.0 (10.4) |
0 (0) | ● | ||||||||
| Gyn | ||||||||||||
| 28 | Gen | 123 | 65.1 (12.5) |
● | ||||||||
| 31 | Neur | 60.6 (11.5) |
● | |||||||||
| Gyn|Ortho|Urol|Vasc | ||||||||||||
| 28 | Gen | 1234 | ≥60 |
28.1 |
0 (0) | ● | ● | |||||
| 19 | Neur | ≥60 |
27.6 |
0 (0) | ● | ● | ||||||
| Spine | ||||||||||||
| 106 | Gen | NR | 72.0 {69-76} |
28 {27-29} |
0 (0) | ● | ||||||
| 111 | Neur | 73.0 {69-78} |
29 {27-29} |
0 (0) | ● | |||||||
| Vasc | ||||||||||||
| 20 | Gen | 23 | 61.2 (10.5) |
● | ||||||||
| 20 | Neur | 60.6 (9.7) |
● | |||||||||
| Various | ||||||||||||
| 217 | Gen | 1234 | 70.8 [61-84] |
0 (0) | ● | |||||||
| 211 | Neur | 71.1 [61-84] |
0 (0) | ● | ● | |||||||
| Other | ||||||||||||
| 20 | Gen | 123 | 62.6 (10.7) |
● | ||||||||
| 20 | Neur | 65.5 (16.8) |
● | |||||||||
| Gen: general; Neur: neuraxial; PS: physical stutus; Vol: volatile; TIVA: total intravenous anesthesia; NR: not reported; Epid: epidural; CSE: combined spinal and epidural; Ortho: orthopedic; Urol: urological; GI: gastrointestinal; Neuro: neurologic; Gyn: gynecologic; Vasc: vascular; Ophtho: opthalomogic; Fx: fracture; TKA: total knee arthroplasty; THA: total hip arthroplasty. | ||||||||||||
| a Mean Med (SD)[Range]{IQR}. | ||||||||||||
| b Blank if no information provided. | ||||||||||||
| c Analysis of Neuman 2021. | ||||||||||||
| d Propofol. | ||||||||||||
| e Midazolam. | ||||||||||||
| f Diazepam. | ||||||||||||
Delirium Incidence
| Study | N | Arm | MMSE (preop)a |
Dementia N (%)b |
Scale | Day(s)c | Incidence Proportion | RR (95% CI) | |
|---|---|---|---|---|---|---|---|---|---|
| N (%) | 0 – 100% | ||||||||
| Hip Fx | |||||||||
| 164 | Gen | unspecified | Stay | 0 (0) | — | ||||
| 158 | Neur | 3 (1.9) | Not estimated | ||||||
| 33 | Gen | 25.7 (2.9) |
0 (0) | CAM | Stay | 4 (12.1) | — | ||
| 37 | Neur | 25.3 (0.9) |
0 (0) | 10 (27.0) | 2.23 (0.77-6.44) | ||||
| 118 | Gen | 22 (18.6) | unspecified | Stay | 17 (14.4) | — | |||
| 58 | Neur | 10 (17.2) | 8 (13.8) | 0.96 (0.44-2.09) | |||||
| 30 | Gen | 0 (0) | DSM | Stay | 1 (3.3) | — | |||
| 30 | Neur | 0 (0) | 1 (3.3) | 1.00 (0.07-15.26) | |||||
| 629 | Gen | 94 (11.7) | CAM | 3 | 124 (19.7) | — | |||
| 633 | Neur | 109 (13.7) | 130 (20.5) | 1.04 (0.84-1.30)e | |||||
| 467 | Gen | 20 {15-25} |
190 (40.3) | CAM | 7 | 21 (4.5) | — | ||
| 466 | Neur | 20 {15-24} |
182 (38.6) | 24 (5.2) | 1.15 (0.65-2.03) | ||||
| 190 | Gen | 18 (100) | CAM | 7 | 18 (9.5) | — | |||
| 182 | Neur | 21 (100) | 21 (11.5) | 1.22 (0.67-2.21) | |||||
| 281 | Gen | 0 (0) | CAM | 7 | 6 (2.1) | — | |||
| 289 | Neur | 0 (0) | 8 (2.8) | 1.30 (0.46-3.69) | |||||
| 211 | Gen | 64 (100) | CAM | Stay | 64 (30.3) | — | |||
| 225 | Neur | 71 (100) | 71 (31.6) | 1.04 (0.79-1.38)f | |||||
| 418 | Gen | 0 (0) | CAM | Stay | 60 (14.4) | — | |||
| 408 | Neur | 0 (0) | 59 (14.5) | 1.01 (0.72-1.40)g | |||||
| GI/Abd | |||||||||
| 116 | Gen | 0 (0) | DRS | Stay | 15 (12.9) | — | |||
| 117 | Neur | 0 (0) | 4 (3.4) | 0.26 (0.09-0.77) | |||||
| Spine | |||||||||
| 106 | Gen | 28 {27-29} |
0 (0) | CAM | Stay | 20 (18.9) | — | ||
| 111 | Neur | 29 {27-29} |
0 (0) | 28 (25.2) | 1.34 (0.80-2.22) | ||||
| Various | |||||||||
| 217 | Gen | 0 (0) | unspecified | Stay | 5 (2.3) | — | |||
| 211 | Neur | 0 (0) | 4 (1.9) | 0.82 (0.22-3.02) | |||||
| 28 | Gen | 28.1 |
0 (0) | DSM | 3 | 6 (21.4) | — | ||
| 19 | Neur | 27.6 |
0 (0) | 3 (15.8) | 0.74 (0.21-2.59) | ||||
| Gen: general anesthesia; Neur: neuraxial; RR: risk ratio; MMSE: Mini-Mental State Examination; CAM: Confusion Assessment Method; DRS: Delirium Rating Scale; DSM: Diagnostic and Statistical Manual of Mental Disorders; NR: not reported. | |||||||||
| a Mean Med (SD)[Range]{IQR}. | |||||||||
| b Blank if no information provided. | |||||||||
| c Day(s) over which incidence proportion assessed. Stay indicates duration of hospitalization. | |||||||||
| d Included patients with dementia (O'Brien 2023 report of Neuman 2021; 16.5% of patients in Shin 2020 had dementia, but subgroup results were unreported). | |||||||||
| e Adjusted for sex, fracture type and country. | |||||||||
| f Odds ratio adjusted for sex, fracture type and country 1.08 (95% CI, 0.72–1.62). | |||||||||
| g Odds ratio adjusted for sex, fracture type and country 1.01 (95% CI, 0.69–1.50). | |||||||||
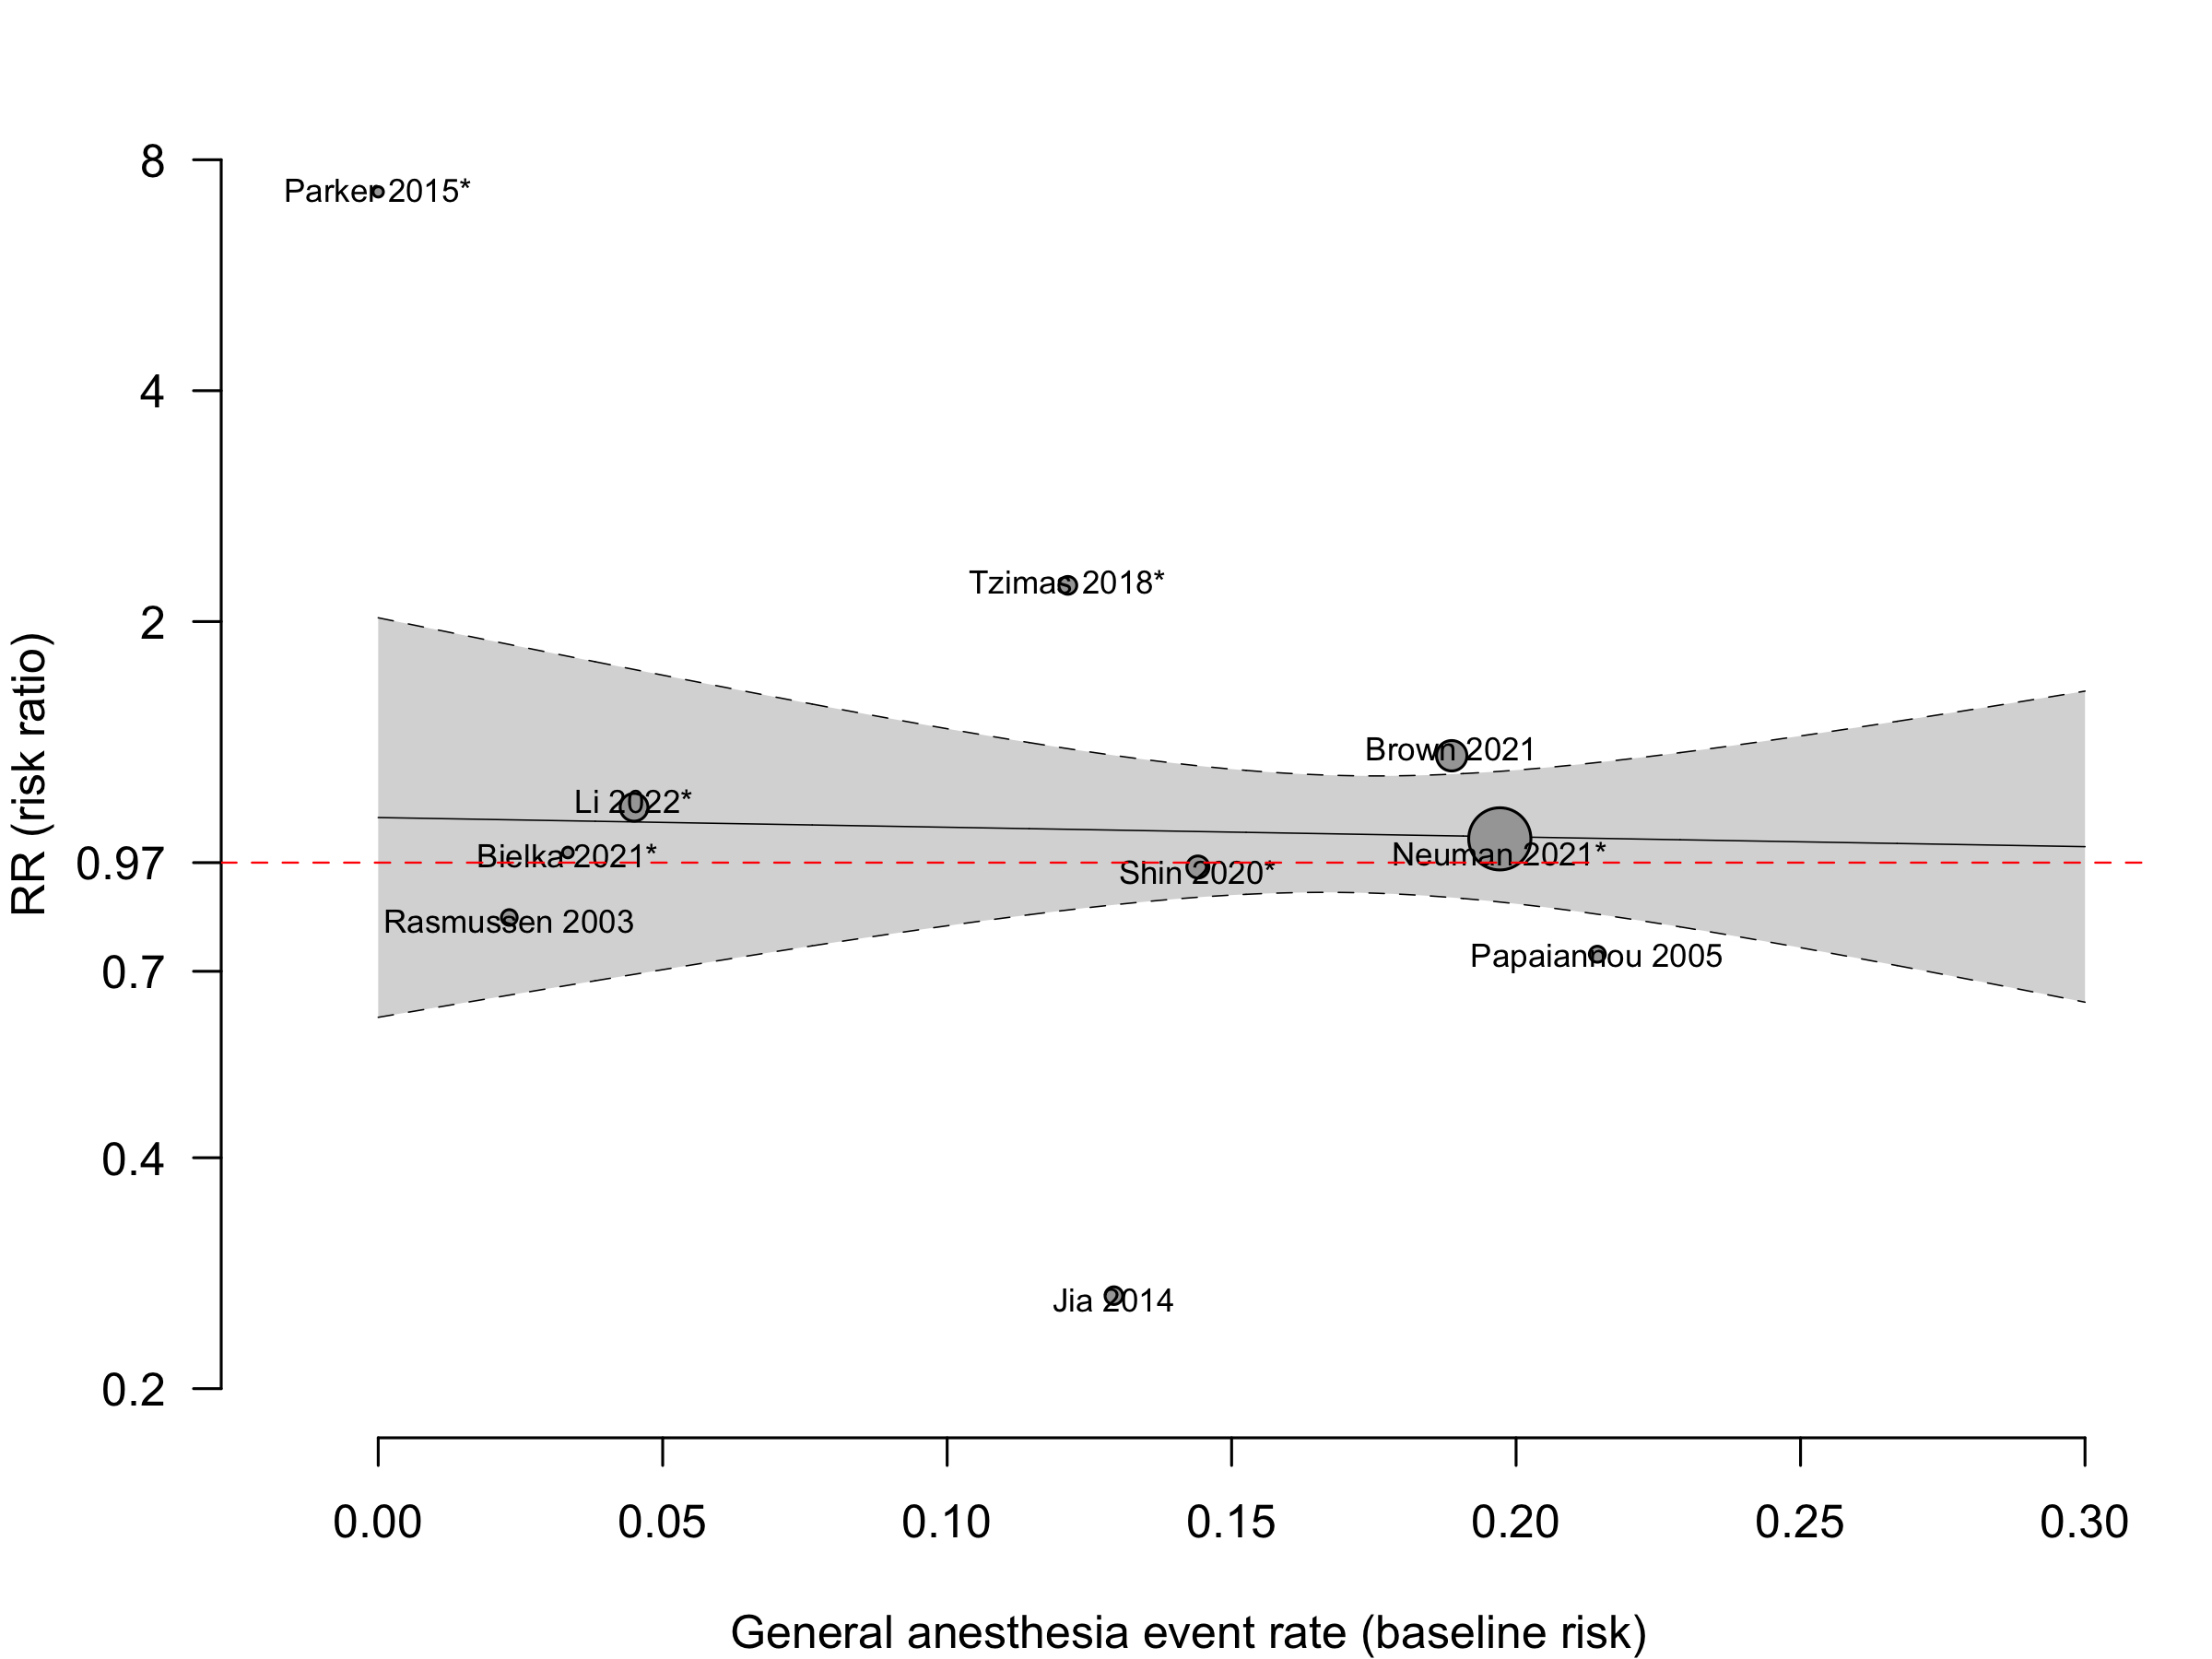
Pooled
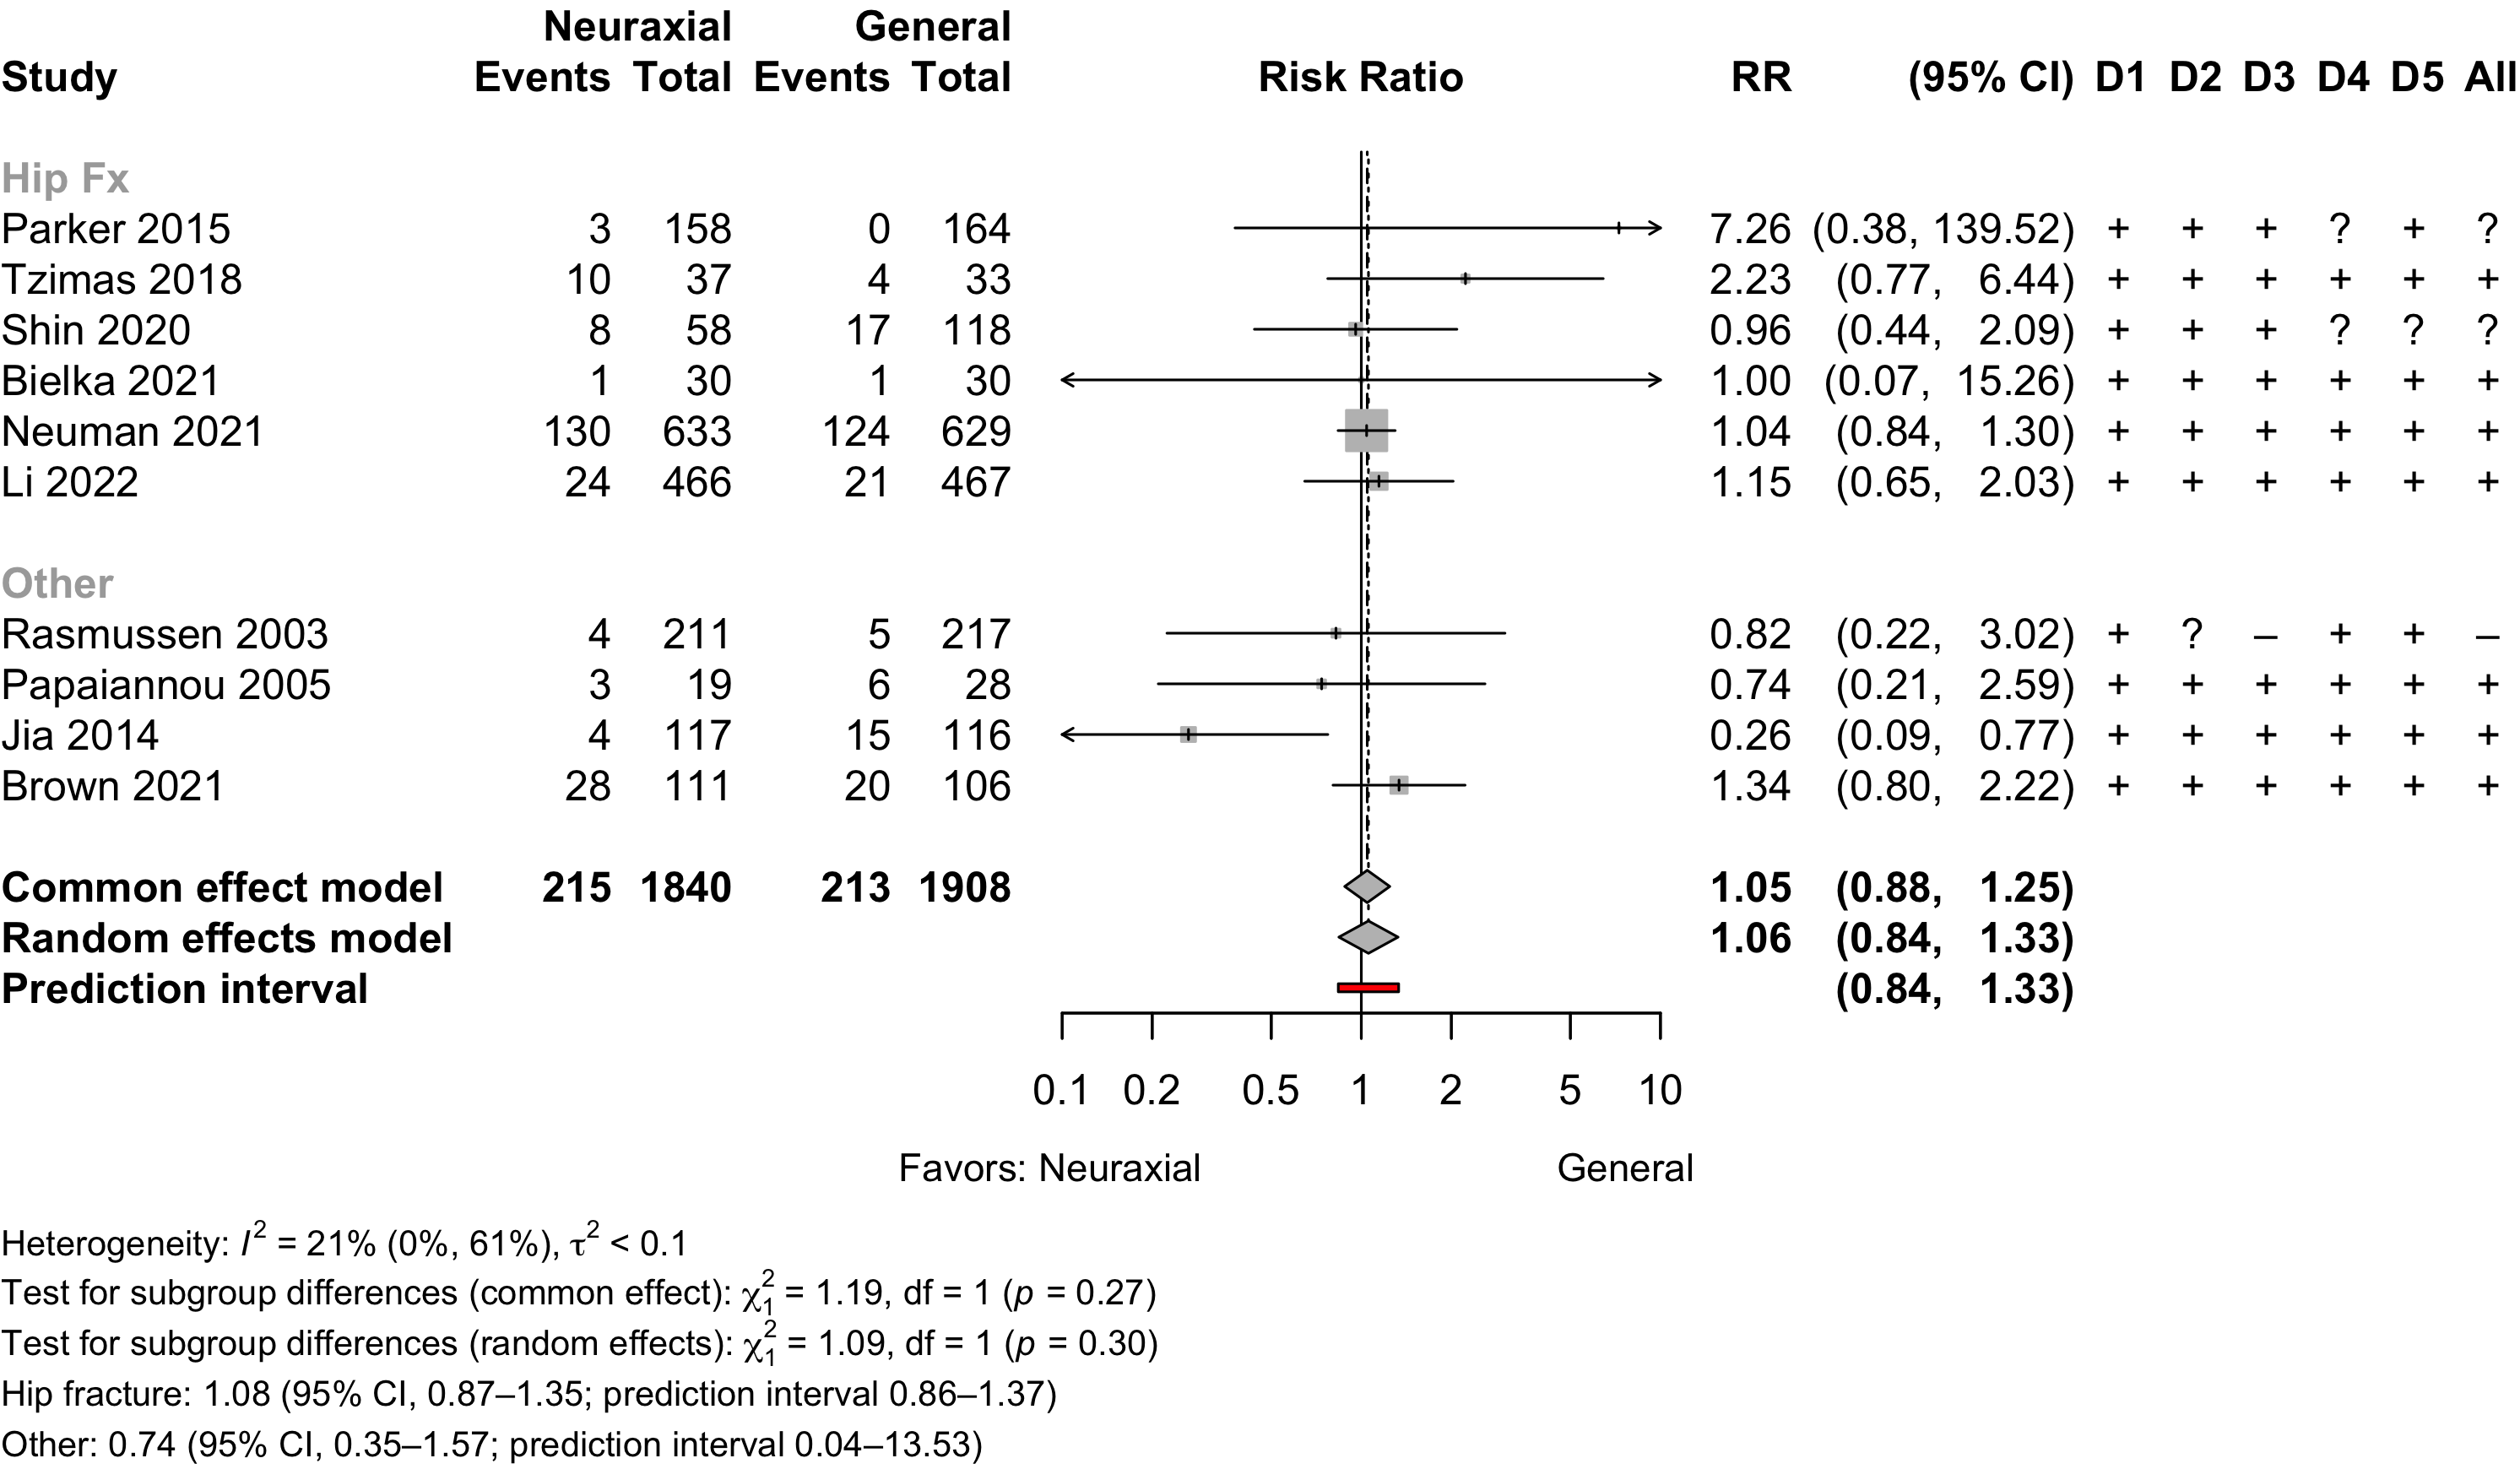
Risk of bias ratings: low +, some concerns ?, high – .
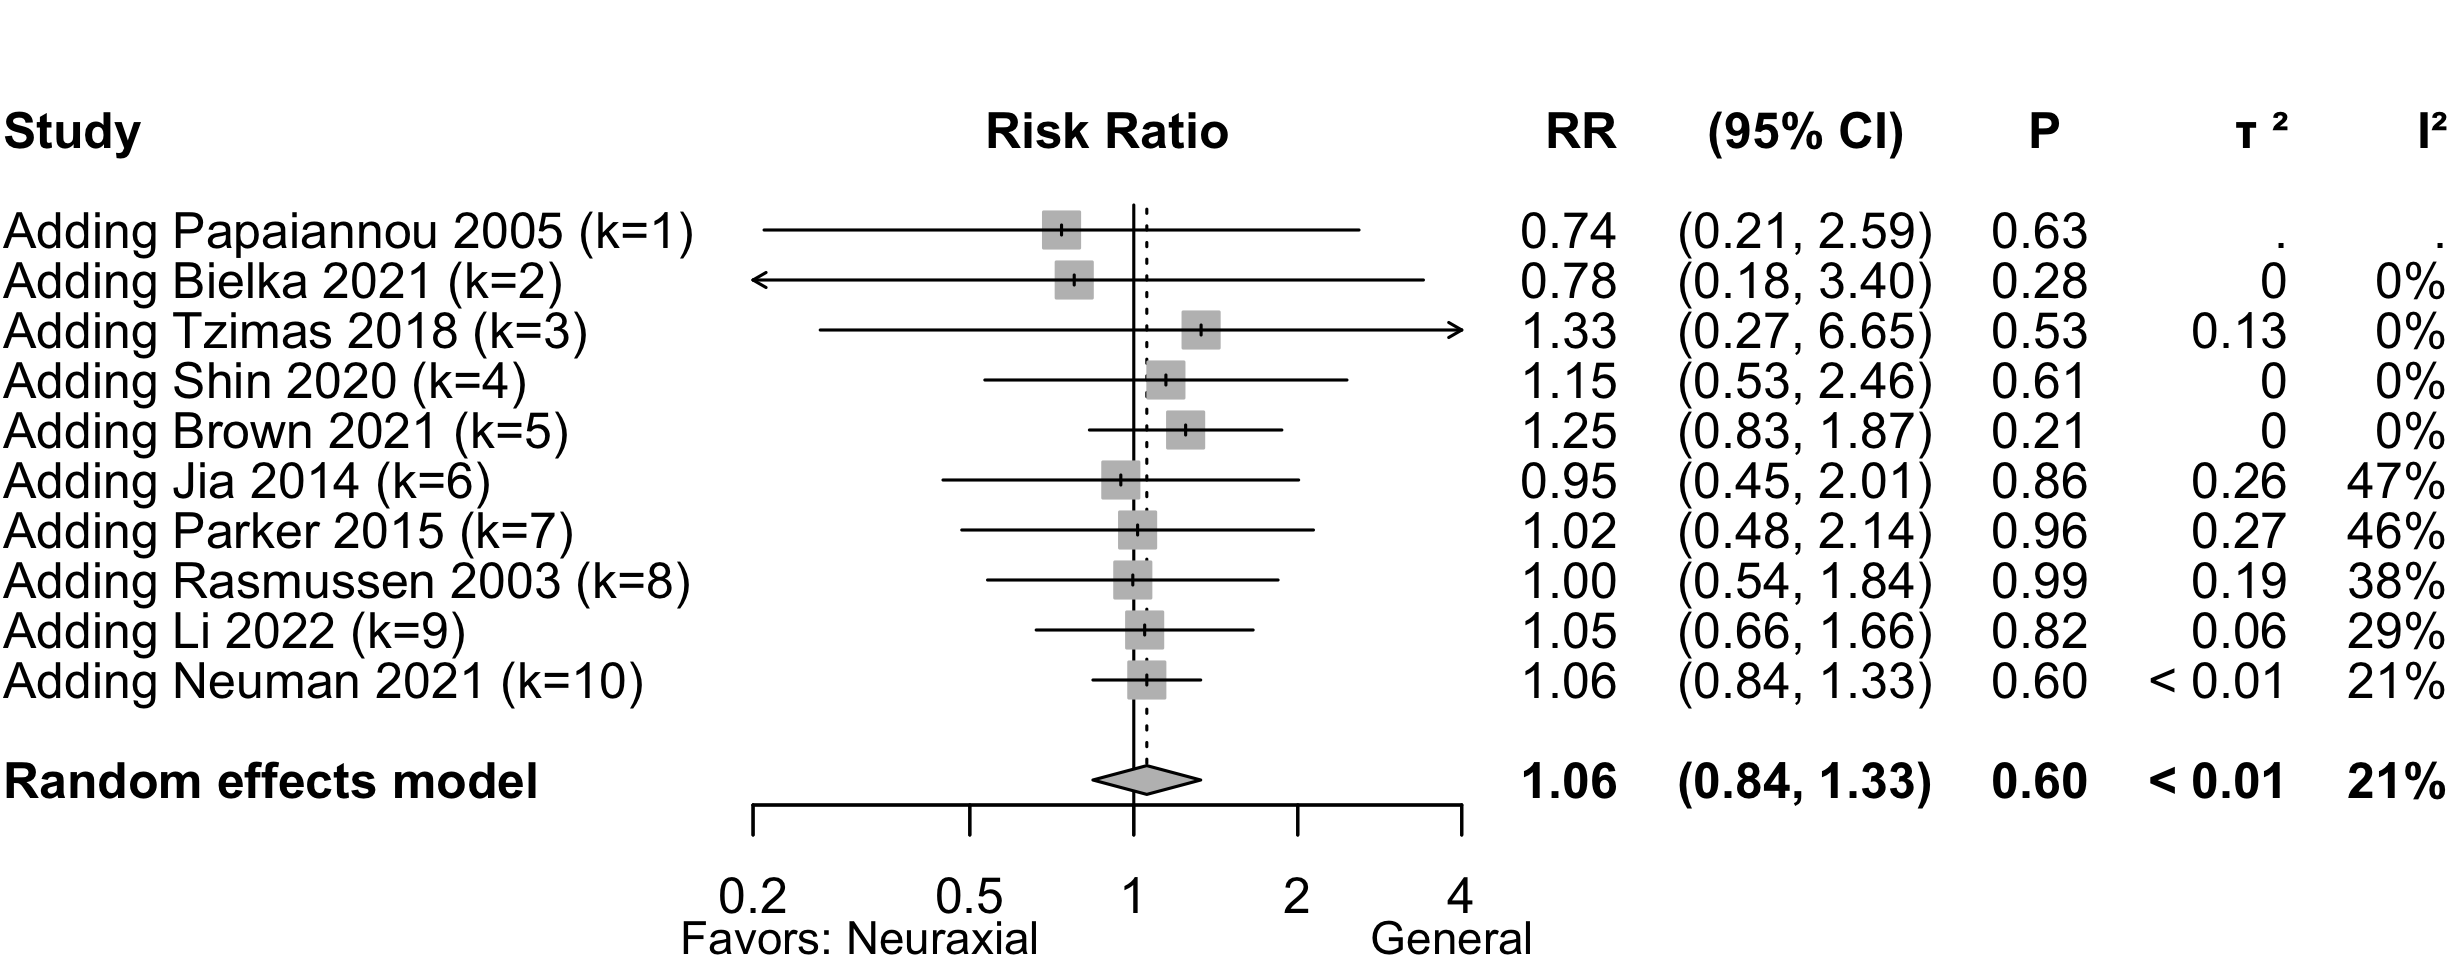
Random effects pooled estimate weights — Neuman 2021 (63.6%), Brown 2021 (11.9%), Li 2022 (9.4%), and Shin 2020 (5.1%).
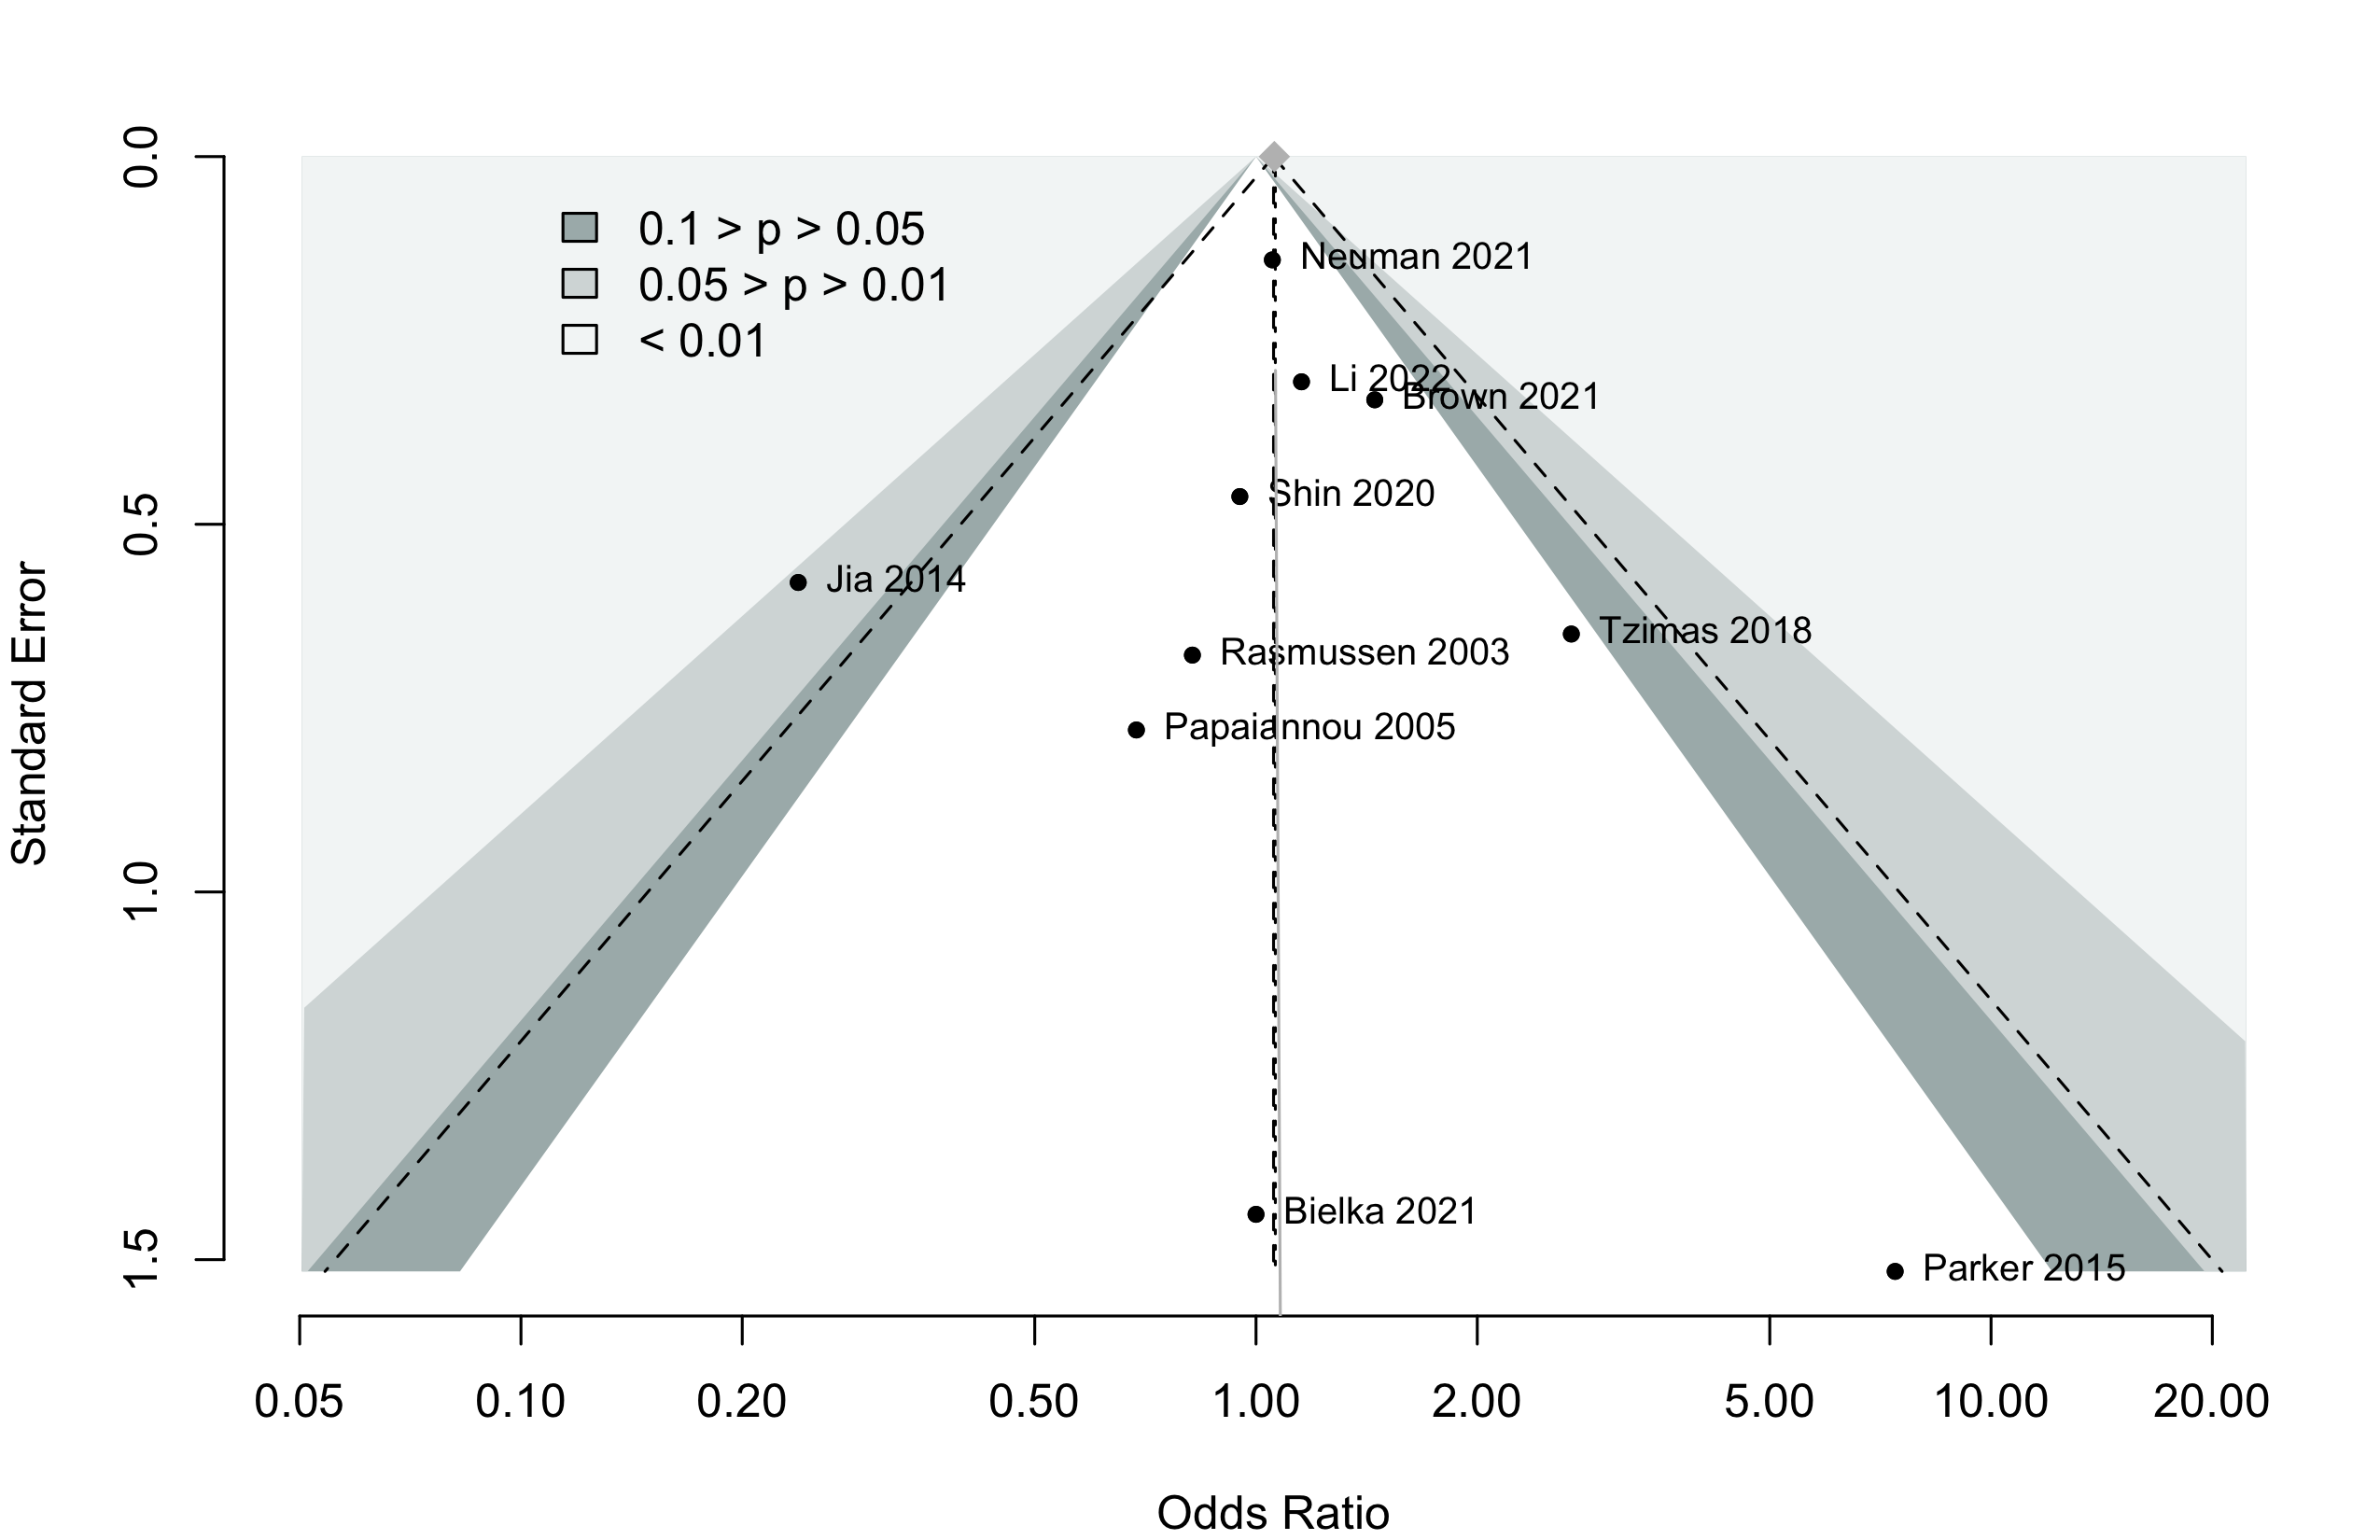
Harbord test for small study effects P = 0.87.
Delirium was designated a primary or secondary outcome in 45.5% and 18.2% of trials, respectively.
In subgroups from O’Brien 2023 (Neuman 2021) and Li 2022 of patients with dementia RR 1.08 (95% CI, 0.83–1.39; common effects model).
In 8 studies including or reporting results for patients without dementia RR 1.03 (95% CI, 0.67–1.57; prediction interval 0.54–1.97).
Overall 14.7 per 100 (95% CI, 13.0 to 16.6)
Hip fracture 15.1 per 100 (95% CI, 13.1 to 17.4)
Other 13.3 per 100 (95% CI, 10.5 to 17.3)
The overall pooled incidence of postoperative delirium (common effect model) with general anesthesia was 14.7 per 100 (95% CI, 13.0 to 16.6), following hip fracture was 15.1 per 100 (95% CI, 13.1 to 17.4), and for other surgical procedures 13.3 per 100 (95% CI, 10.5 to 17.3).
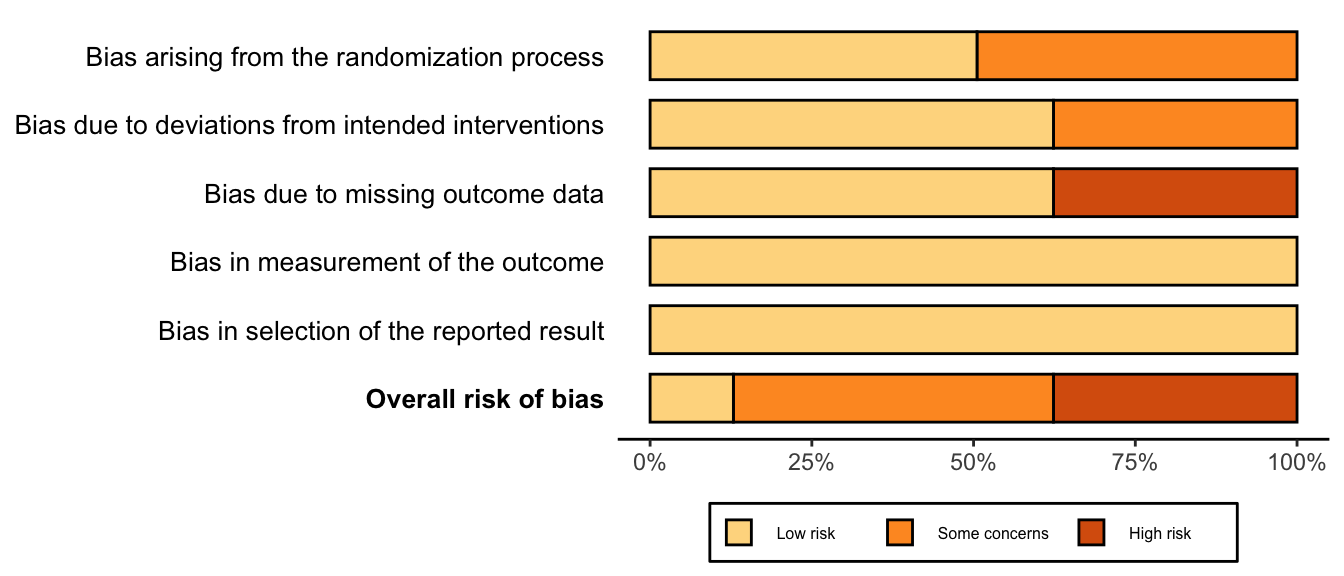
Neurocognitive Disorder
<30 days
| Study | N | Arm | Dementiaa | Preop | Instrument | Dayc | Neurocognitive Disorder <30 days | |||||
|---|---|---|---|---|---|---|---|---|---|---|---|---|
| MMSEb | MMSE | DST | MoCA | Other | N (%) | 0 — 100% | RR (95% CI) | |||||
| 15 | Gen | 29 [24-29] |
✓d |
7 | 3 (20.0) | — | ||||||
| 15 | Neur | 28 [25-30] |
1 (6.7) | 0.33 (0.04-2.85) | ||||||||
| 188 | Gen | 0 (0) | e | 7 | 37 (19.7) | — | ||||||
| 176 | Neur | 0 (0) | 22 (12.5) | 0.64 (0.39-1.03) | ||||||||
| 49 | Gen | 0 (0) | e | 7 | 2 (4.1) | — | ||||||
| 42 | Neur | 0 (0) | 5 (11.9) | 2.92 (0.60-14.26) | ||||||||
| 103 | Gen | f | g | 7 | 46 (44.7) | — | ||||||
| 103 | Neur | f | 50 (48.5) | 1.09 (0.81-1.46) | ||||||||
| Mini-Mental State Exam; DST: Digit Span Test; MoCA: Montreal Cognitive Assessment; RR: risk ratio; Gen: general anesthesia. | ||||||||||||
| a Blank if no information provided. | ||||||||||||
| b Mean Med (SD)[Range]{IQR}. | ||||||||||||
| c Day of assessment (excluded Zhang 2019a conducting assessment at day 1). | ||||||||||||
| d Difference from baseline >2 points. | ||||||||||||
| e Z ≥1.96. | ||||||||||||
| f Did not state excluding patients with dementia, but peformed neuropsycholgical testing prior to surgery | ||||||||||||
| g Not reported. | ||||||||||||
Pooled
- Inverse variance method (random effects model)
- Restricted maximum-likelihood estimator for τ2
- Q-Profile method for confidence interval of τ2 and τ
- Prediction interval based on t-distribution (df = 2)
Neurocognitive Disorder
30 days to 1 year
| Study | N | Arm | Dementia | Preop | Instrument | Dayb | Postoperative Neurocognitive Disorder | |||||
|---|---|---|---|---|---|---|---|---|---|---|---|---|
| MMSEa | MMSE | DST | MoCA | Other | N (%) | 0 — 100% | RR (95% CI) | |||||
| Randomized Clinical Trial | ||||||||||||
| 188 | Gen | 0 (0) | c | 90 | 25 (13.3) | — | ||||||
| 176 | Neur | 0 (0) | 23 (13.1) | 0.98 (0.58-1.67) | ||||||||
| Mini-Mental State Exam; DST: Digit Span Test; MoCA: Montreal Cognitive Assessment; RR: risk ratio; Gen: general anesthesia. | ||||||||||||
| a Mean Med (SD)[Range]{IQR}. | ||||||||||||
| b Day of assessment. | ||||||||||||
| c Z ≥1.96. | ||||||||||||
Physical Function
| Study | N | Arma | Unable to Walk N (%)b |
0 — 100% | RR (95% CI) |
|---|---|---|---|---|---|
| 701 | Gen | 101 (14.4) | |||
| 684 | Neur | 104 (15.2) | 1.05 (0.82–1.36)c | ||
| a Gen: general anesthesia; Neur: neuraxial anesthesia. | |||||
| b Inability to walk without human assistance at 60 days. | |||||
| c Equivalent standardized mean difference: 0.04 (95% CI, -0.13 to 0.20). | |||||
| Study | N | Arm | Agea | Scaleb | Range | Days | Ratinga | SMD (95% CI) |
|---|---|---|---|---|---|---|---|---|
| 30-90 days | ||||||||
| 28 | Gen | 65.1 (12.5) |
SF-36 physical | 0→100 | 84 | 44.2 (8.3) |
||
| 31 | Neur | 60.6 (11.5) |
47.1 (12.7) |
0.26 (-0.25 to 0.78) | ||||
| 242 | Gen | 78.4 (10.6) |
WHODAS 2.0 | 0←100 | 60 | 18 [6-32] |
||
| 225 | Neur | 77.7 (10.7) |
23 [8-43] |
0.36 (0.18 to 0.55) | ||||
| 101 | Gen | 68.0 {61-71} |
WOMACc | 0←96 | 90 | 17.5 (14.6)d |
||
| 99 | Neur | 68.0 {62-70} |
15.0 (13.9)d |
-0.18 (-0.45 to 0.10) | ||||
| >90 days | ||||||||
| 101 | Gen | 68.0 {61-71} |
WOMACc | 0←96 | 180 | 13.8 (15.3)d |
||
| 99 | Neur | 68.0 {62-70} |
13.6 (14.6)d |
-0.01 (-0.29 to 0.26) | ||||
| SMD: standardized mean difference; Gen: general; Neur: neuraxial. | ||||||||
| a Mean Med (SD)[Range]{IQR}. | ||||||||
| b Arrow direction indicates better functional outcome. | ||||||||
| c Composite WOMAC includes pain, stiffness, and physical function. Physical function accounts for 68 of the 96 points. | ||||||||
| d Standard deviations derived from confidence intervals and appear small, but are consistent with reported statistical results. | ||||||||
Pooled
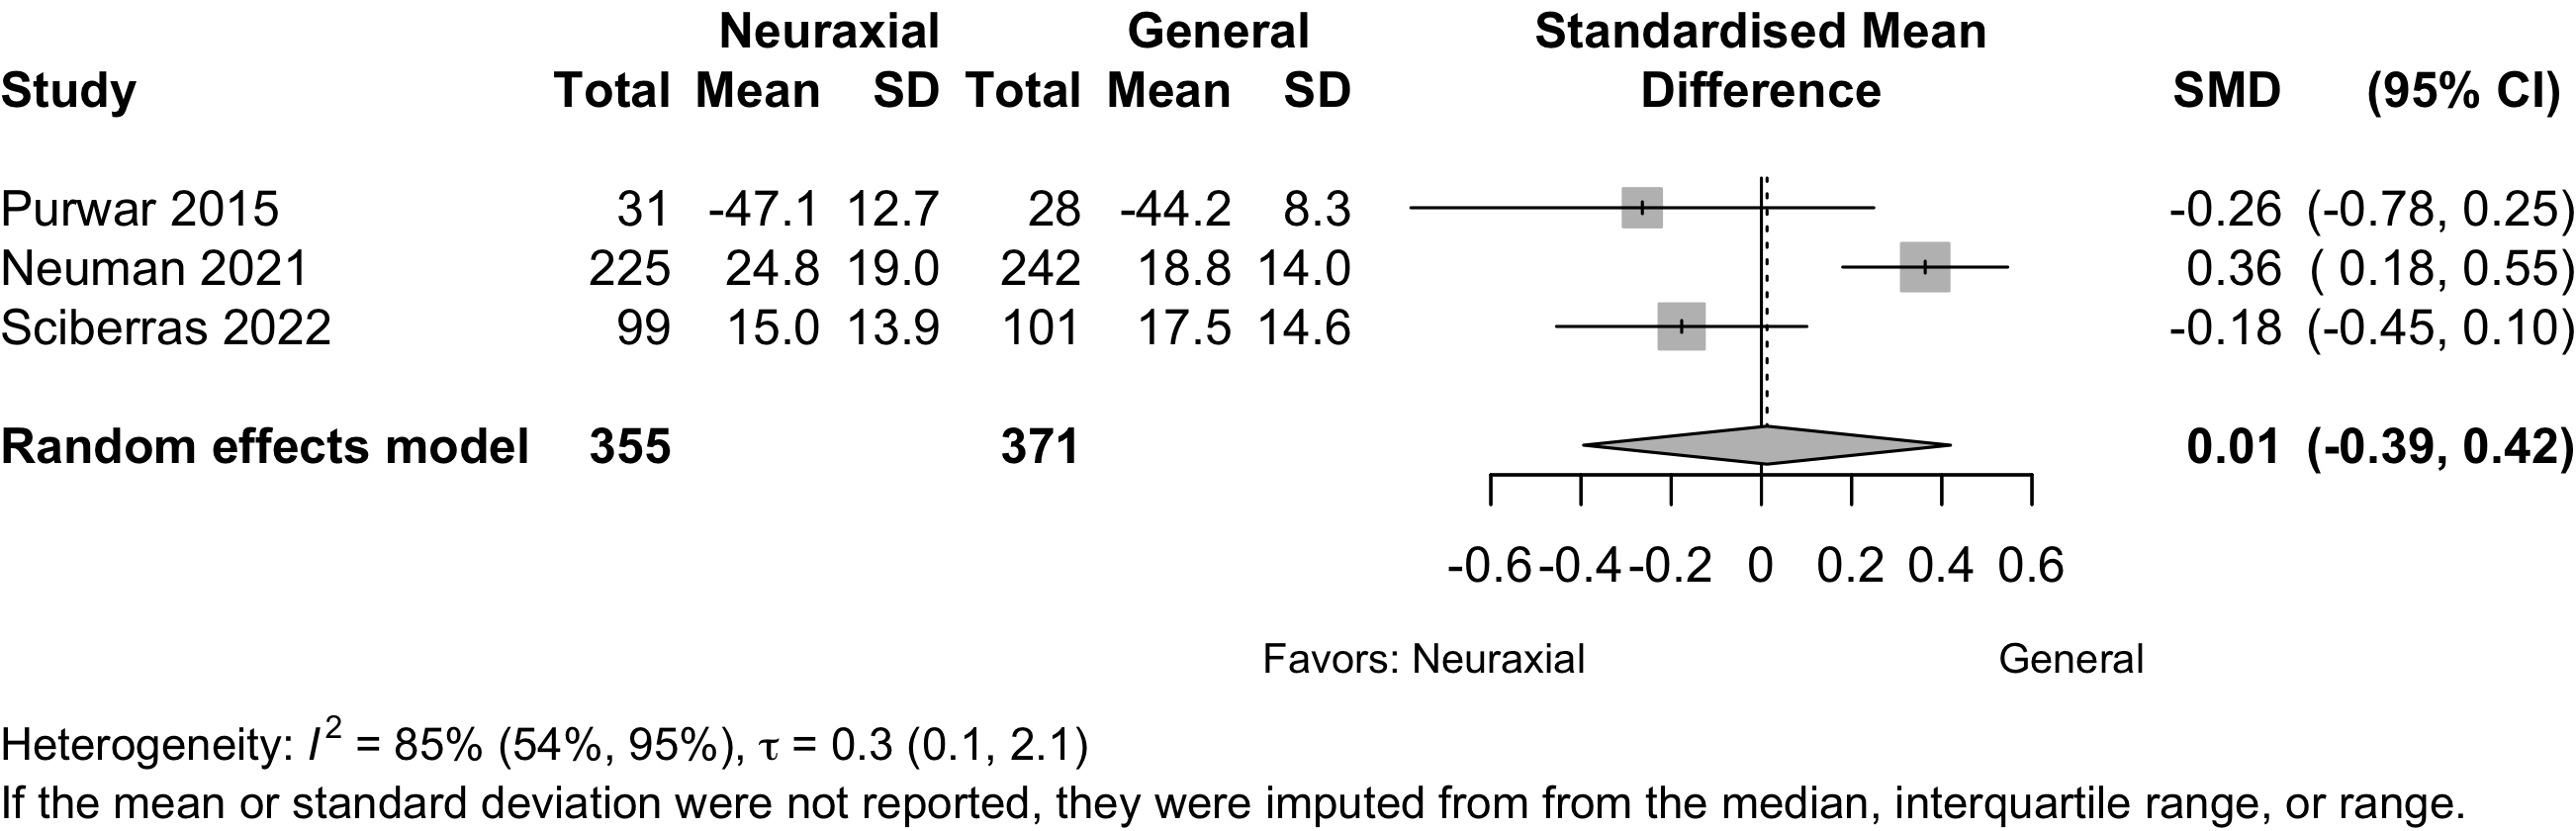
Using Neuman 2021 primary result from 1385 participants in a sensitivity analysis yield a pooled SMD -0.07 (95% CI, -0.25 to 0.12) and equivalent OR 0.89 (95% CI, 0.63–1.24).
Complications
| Study | N | Arm | Age | Surgery | N (%) | 0 – 100% | RD (95% CI) |
|---|---|---|---|---|---|---|---|
| MI | |||||||
| 164 | Gen | 83.0 [59-99] |
Ortho | 1 (0.6) | — | ||
| 158 | Neur | 82.9 [25-105] |
1 (0.6) | 0.0% (-1.7, 1.7) | |||
| 66 | Gen | 68.0 (11.0) |
Ortho | 2 (3.0) | — | ||
| 66 | Neur | 67.0 (12.0) |
1 (1.5) | -1.5% (-6.6, 3.6) | |||
| 66 | Neur | 66.0 (10.0) |
2 (3.0) | 0.0% (-5.8, 5.8) | |||
| 793 | Gen | 78.4 (10.6) |
Ortho | 9 (1.1) | — | ||
| 783 | Neur | 77.7 (10.7) |
6 (0.8) | -0.4% (-1.3, 0.6) | |||
| 471 | Gen | 77.0 {71-82} |
Ortho | 0 (0) | — | ||
| 471 | Neur | 77.0 {72-82} |
1 (0.2) | 0.2% (-0.4, 0.8) | |||
| 106 | Gen | 72.0 {69-76} |
Spine | 0 (0) | — | ||
| 111 | Neur | 73.0 {69-78} |
1 (0.9) | 0.9% (-1.6, 3.4) | |||
| Cardiac Arrest | |||||||
| 793 | Gen | 78.4 (10.6) |
Ortho | 0 (0) | — | ||
| 783 | Neur | 77.7 (10.7) |
2 (0.3) | 0.3% (-0.2, 0.7) | |||
| Other Cardiac | |||||||
| 18 | Gen | 67.7 (15.1) |
GI/Abd | 3 (16.7) | — | ||
| 18 | Neur | 64.9 (10.3) |
2 (11.1) | -5.6% (-28.1, 17.0) | |||
| 30 | Gen | 69.0 {62-74} |
Ortho | 2 (6.7) | — | ||
| 30 | Neur | 65.0 {62-68} |
0 (0) | -6.7% (-17.2, 3.9) | |||
| 164 | Gen | 83.0 [59-99] |
Ortho | 3 (1.8) | — | ||
| 158 | Neur | 82.9 [25-105] |
0 (0) | -1.8% (-4.2, 0.5) | |||
| 60 | Gen | 79.4 (7.7) |
Ortho | 3 (5.0) | — | ||
| 58 | Gen | 80.5 (6.7) |
2 (3.4) | -1.6% (-8.8, 5.7) | |||
| 58 | Neur | 81.6 (6.7) |
2 (3.4) | -1.6% (-8.8, 5.7) | |||
| 29 | Gen | 73.0 {72-74} |
Ortho | 1 (3.4) | — | ||
| 29 | Neur | 72.0 {70-73} |
3 (10.3) | 6.9% (-6.0, 19.8) | |||
Li 2022e,f |
471 | Gen | 77.0 {71-82} |
Ortho | 4 (0.8) | — | |
| 471 | Neur | 77.0 {72-82} |
3 (0.6) | -0.2% (-1.3, 0.9) | |||
| 20 | Gen | 62.6 (10.7) |
Other | 0 (0) | — | ||
| 20 | Neur | 65.5 (16.8) |
1 (5.0) | 5.0% (-7.8, 17.8) | |||
| 40 | Gen | 73.0 (6.0) |
Urol | 0 (0) | — | ||
| 40 | Neur | 71.0 (6.0) |
0 (0) | 0.0% (-4.8, 4.8) | |||
| 217 | Gen | 70.8 [61-84] |
Various | 2 (0.9) | — | ||
| 211 | Neur | 71.1 [61-84] |
3 (1.4) | 0.5% (-1.5, 2.5) | |||
| Stroke | |||||||
| 793 | Gen | 78.4 (10.6) |
Ortho | 7 (0.9) | — | ||
| 783 | Neur | 77.7 (10.7) |
5 (0.6) | -0.2% (-1.1, 0.6) | |||
| 471 | Gen | 77.0 {71-82} |
Ortho | 1 (0.2) | — | ||
| 471 | Neur | 77.0 {72-82} |
0 (0) | -0.2% (-0.8, 0.4) | |||
| 106 | Gen | 72.0 {69-76} |
Spine | 0 (0) | — | ||
| 111 | Neur | 73.0 {69-78} |
2 (1.8) | 1.8% (-1.2, 4.8) | |||
| AKI/Renal Failure | |||||||
| 164 | Gen | 83.0 [59-99] |
Ortho | 2 (1.2) | — | ||
| 158 | Neur | 82.9 [25-105] |
0 (0) | -1.2% (-3.3, 0.8) | |||
| 66 | Gen | 68.0 (11.0) |
Ortho | 1 (1.5) | — | ||
| 66 | Neur | 67.0 (12.0) |
0 (0) | -1.5% (-5.6, 2.6) | |||
| 66 | Neur | 66.0 (10.0) |
0 (0) | -1.5% (-5.6, 2.6) | |||
| 793 | Gen | 78.4 (10.6) |
Ortho | 55 (6.9) | — | ||
| 783 | Neur | 77.7 (10.7) |
32 (4.1) | -2.8% (-5.1, -0.6) | |||
| 106 | Gen | 72.0 {69-76} |
Spine | 0 (0) | — | ||
| 111 | Neur | 73.0 {69-78} |
1 (0.9) | 0.9% (-1.6, 3.4) | |||
| Pulmonary | |||||||
| 60 | Gen | 79.4 (7.7) |
Ortho | 4 (6.7) | — | ||
| 58 | Gen | 80.5 (6.7) |
5 (8.6) | 2.0% (-7.6, 11.5) | |||
| 58 | Neur | 81.6 (6.7) |
4 (6.9) | 0.2% (-8.8, 9.3)j,k | |||
| Pneumonia | |||||||
| 30 | Gen | 69.0 {62-74} |
Ortho | 1 (3.3) | — | ||
| 30 | Neur | 65.0 {62-68} |
0 (0) | -3.3% (-12.1, 5.4) | |||
| 164 | Gen | 83.0 [59-99] |
Ortho | 3 (1.8) | — | ||
| 158 | Neur | 82.9 [25-105] |
2 (1.3) | -0.6% (-3.3, 2.1) | |||
| 66 | Gen | 68.0 (11.0) |
Ortho | 1 (1.5) | — | ||
| 66 | Neur | 67.0 (12.0) |
0 (0) | -1.5% (-5.6, 2.6) | |||
| 66 | Neur | 66.0 (10.0) |
1 (1.5) | 0.0% (-4.2, 4.2) | |||
| 29 | Gen | 73.0 {72-74} |
Ortho | 4 (13.8) | — | ||
| 29 | Neur | 72.0 {70-73} |
1 (3.4) | -10.3% (-24.5, 3.9) | |||
| 793 | Gen | 78.4 (10.6) |
Ortho | 16 (2.0) | — | ||
| 783 | Neur | 77.7 (10.7) |
8 (1.0) | -1.0% (-2.2, 0.2) | |||
| 471 | Gen | 77.0 {71-82} |
Ortho | 1 (0.2) | — | ||
| 471 | Neur | 77.0 {72-82} |
0 (0) | -0.2% (-0.8, 0.4) | |||
| 106 | Gen | 72.0 {69-76} |
Spine | 0 (0) | — | ||
| 111 | Neur | 73.0 {69-78} |
2 (1.8) | 1.8% (-1.2, 4.8) | |||
| Pulmonary Congestion | |||||||
| 793 | Gen | 78.4 (10.6) |
Ortho | 8 (1.0) | — | ||
| 783 | Neur | 77.7 (10.7) |
9 (1.1) | 0.1% (-0.9, 1.2) | |||
| Pulmonary Embolism | |||||||
| 60 | Gen | 68.0 (7.0) |
Ortho | 1 (1.7) | — | ||
| 60 | Neur | 67.0 (7.0) |
1 (1.7) | 0.0% (-4.6, 4.6) | |||
| 164 | Gen | 83.0 [59-99] |
Ortho | 2 (1.2) | — | ||
| 158 | Neur | 82.9 [25-105] |
0 (0) | -1.2% (-3.3, 0.8) | |||
| 66 | Gen | 68.0 (11.0) |
Ortho | 2 (3.0) | — | ||
| 66 | Neur | 67.0 (12.0) |
0 (0) | -3.0% (-8.0, 2.0) | |||
| 66 | Neur | 66.0 (10.0) |
1 (1.5) | -1.5% (-6.6, 3.6) | |||
| 793 | Gen | 78.4 (10.6) |
Ortho | 5 (0.6) | — | ||
| 783 | Neur | 77.7 (10.7) |
4 (0.5) | -0.1% (-0.9, 0.6) | |||
| 106 | Gen | 72.0 {69-76} |
Spine | 1 (0.9) | — | ||
| 111 | Neur | 73.0 {69-78} |
1 (0.9) | -0.0% (-2.6, 2.5) | |||
| 217 | Gen | 70.8 [61-84] |
Various | 2 (0.9) | — | ||
| 211 | Neur | 71.1 [61-84] |
0 (0) | -0.9% (-2.5, 0.6) | |||
| Reintubation | |||||||
| 793 | Gen | 78.4 (10.6) |
Ortho | 7 (0.9) | — | ||
| 783 | Neur | 77.7 (10.7) |
4 (0.5) | -0.4% (-1.2, 0.4) | |||
| Gen: general anesthesia; Neur: neuraxial; RD: risk difference; Ortho: orthopedic; GI: gastrointestinal; Abd: abdominal; PE: pulmonary embolism; Ophtho: ophthalmologic; AKI: acute kidney injury. | |||||||
| a Bradycardia. | |||||||
| b Tachycardia. | |||||||
| c Arrhythmia. | |||||||
| d MI, heart failure, new onset arrhythmia. | |||||||
| e Bradycardia or tachycardia. | |||||||
| f Also reported hypo- (12.3% vs. 9.8%) or hypertension (3.8% vs. 12.8%), and left heart failure (0.9% vs. 0%). | |||||||
| g Unspecified adverse cardiac events. | |||||||
| h Renal failure | |||||||
| i AKI | |||||||
| j Verus combined general arms — RD 0.7% (-8.8 to 7.4), RR 0.90 (0.28–2.81). | |||||||
| k With general arms combined RR 0.90 (95% CI, 0.29–2.81). | |||||||
Pooled
Myocardial Infarction
Bradycardia
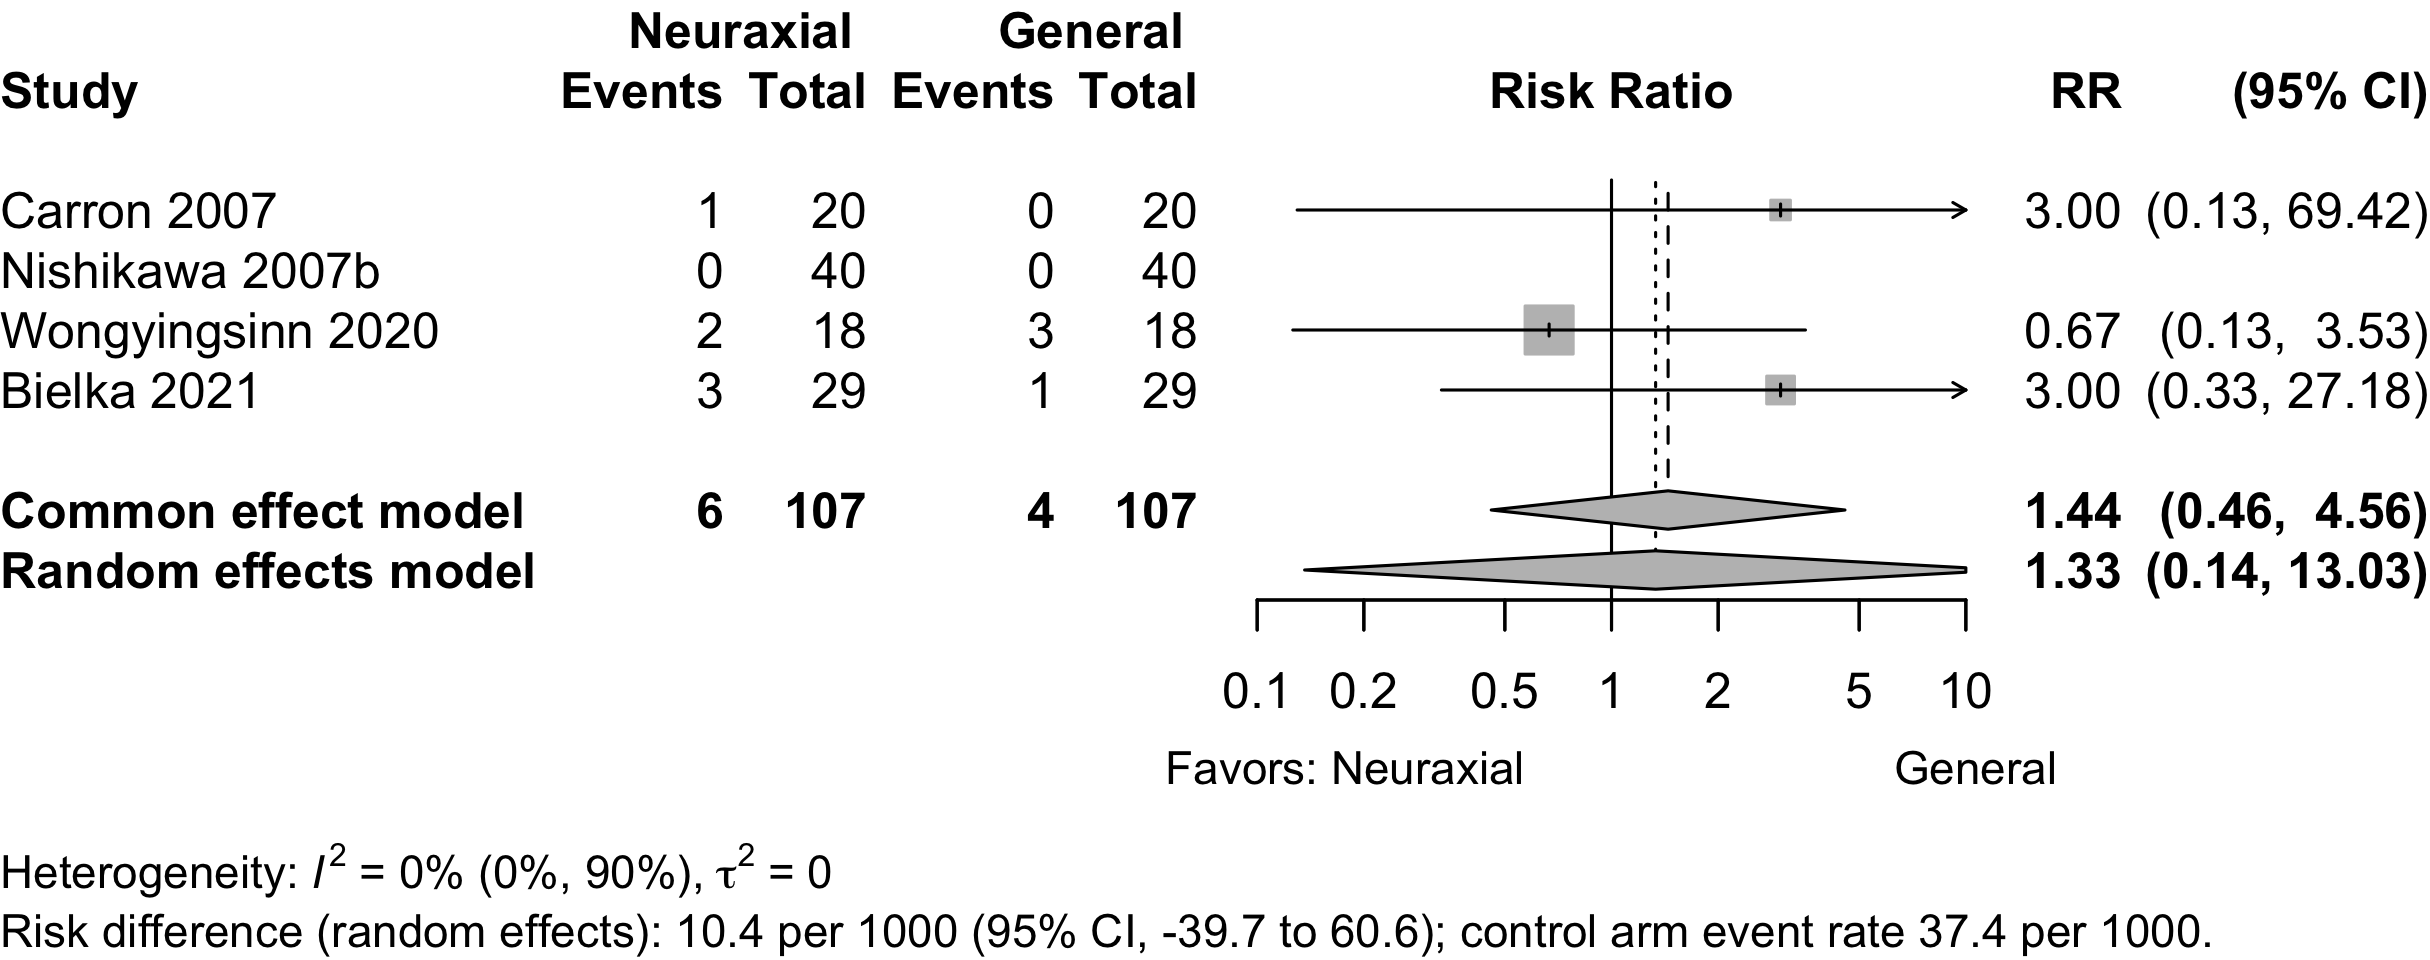
Prediction interval not displayed due to limited events.
Stroke
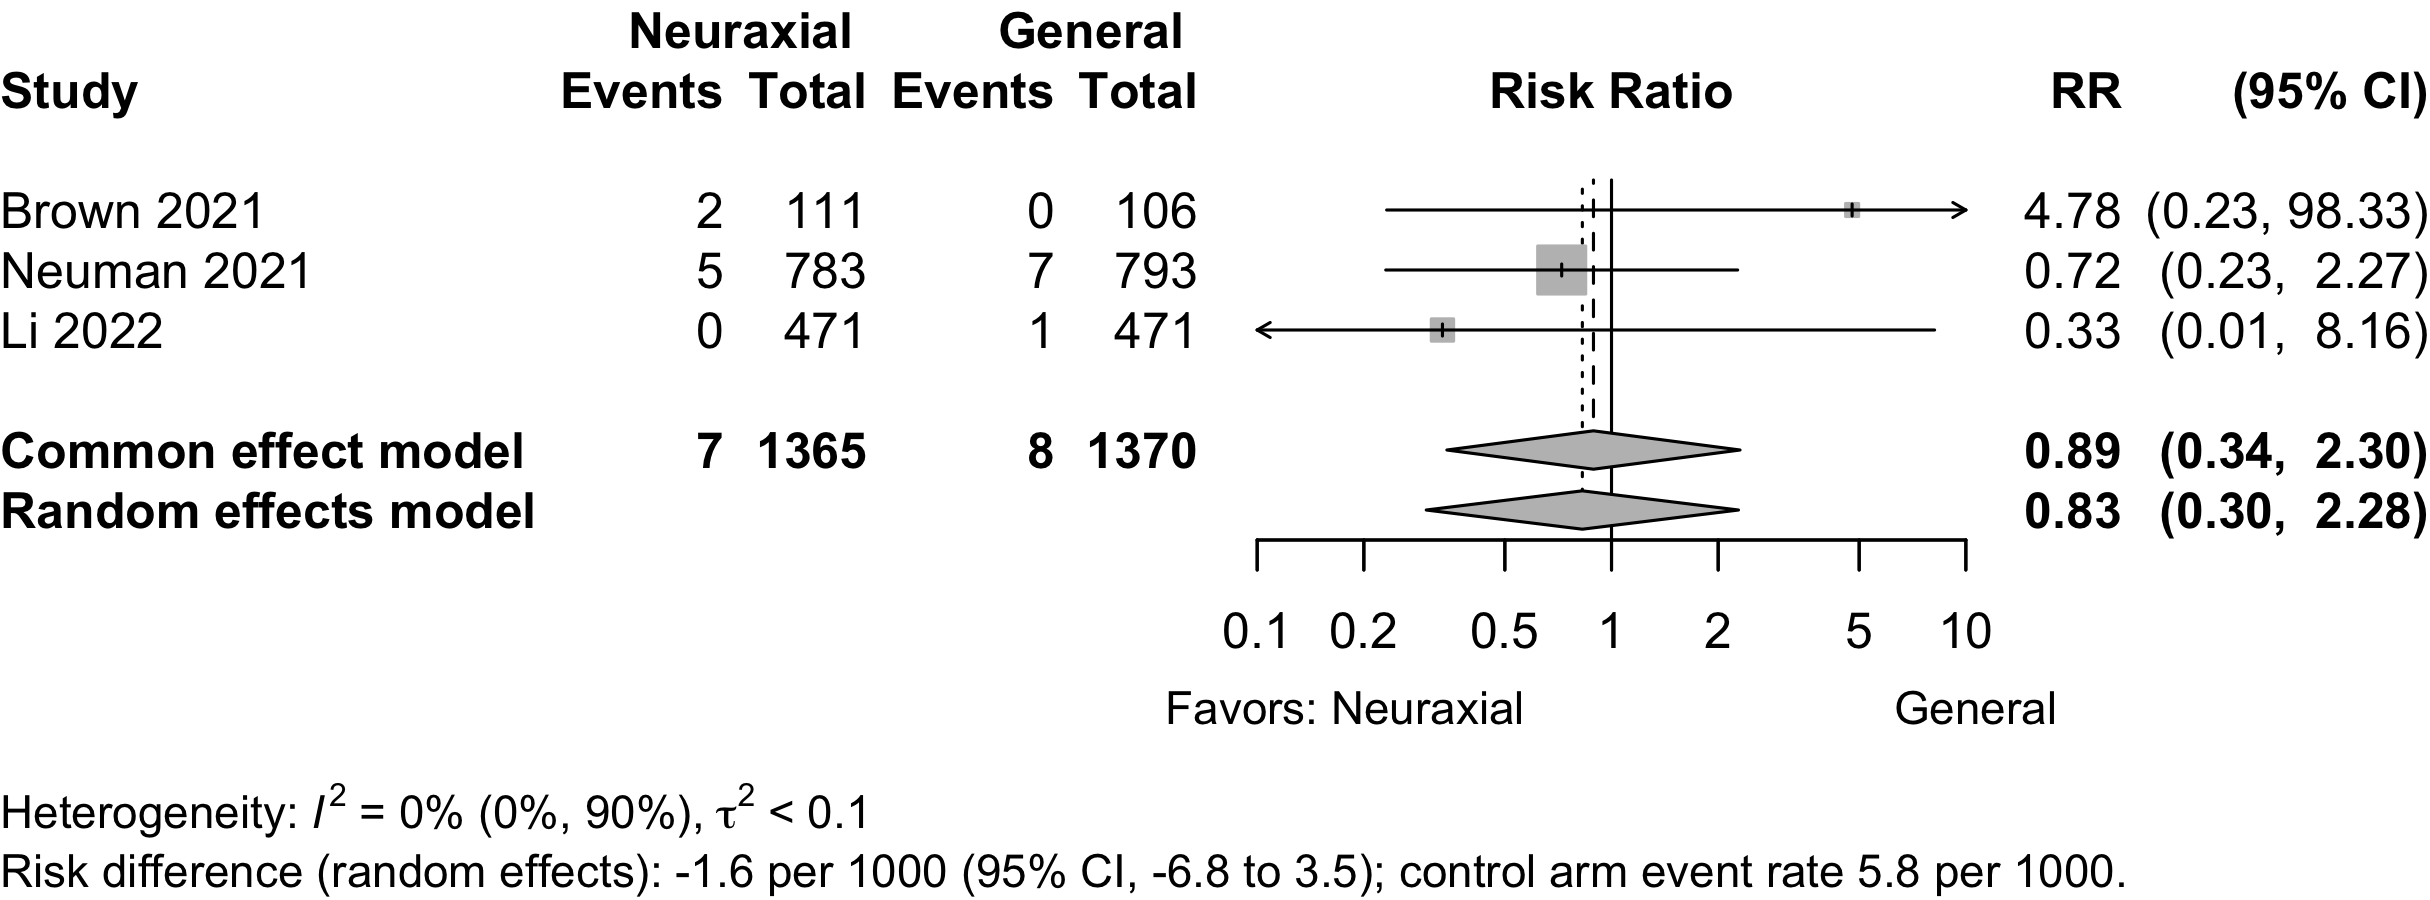
Acute Kidney Injury
Pneumonia
Pulmonary Embolism
Patient Satisfaction
| Study | N | Anesth | ASA | Agea | N (%) | 0 – 100% | RD (95% CI) |
|---|---|---|---|---|---|---|---|
| PS | |||||||
| Orthopedic | |||||||
| 60 | Gen | 123 | 68.0 (9.0) |
55 (91.7)b | — | ||
| 58 | Neur | 66.0 (7.8) |
45 (77.6)b | -14.1% (-26.9, -1.3) | |||
| 21 | Gen | 123 | 85.0 (5.0) |
15 (71.4)c | — | ||
| 19 | Neur | 83.0 (6.0) |
17 (89.5)c | 18.0% (-5.7, 41.8) | |||
| 80 | Gen | NR | 75.4 (5.6) |
69 (86.2)d | — | ||
| 160 | Neur | 75.6 (5.5) |
66 (82.5)d | 3.1% (-5.8, 12.1) | |||
| 661 | Gen | 1234 | 78.0 (11.0) |
564 (85.3)e | — | ||
| 647 | Neur | 78.0 (11.0) |
562 (86.9)e | 1.5% (-2.2, 5.3) | |||
| Urologic | |||||||
| 34 | Gen | NR | 66.0 (6.8) |
32 (94.1)b | — | ||
| 36 | Neur | 65.3 (6.9) |
35 (97.2)b | 3.1% (-6.5, 12.7) | |||
| 40 | Gen | 12 | 73.0 (6.0) |
32 (80.0)f | — | ||
| 40 | Neur | 71.0 (6.0) |
28 (70.0)f | -10.0% (-28.9, 8.9) | |||
| 30 | Gen | 23 | 70.0 (9.6) |
22 (73.3)g | — | ||
| 30 | Neur | 76.4 (11.8) |
25 (83.3)g | 10.0% (-10.7, 30.7) | |||
| Neurosurgical | |||||||
| 25 | Gen | 123 | 62.7 (14.3) |
24 (96.0)b | — | ||
| 25 | Neur | 67.0 (10.4) |
22 (88.0)b | -8.0% (-22.9, 6.9) | |||
| Vascular | |||||||
| 20 | Gen | 23 | 61.2 (10.5) |
12 (60.0)b | — | ||
| 20 | Neur | 60.6 (9.7) |
18 (90.0)b | 30.0% (4.8, 55.2) | |||
| Other | |||||||
| 20 | Gen | 123 | 62.6 (10.7) |
14 (70.0)b | — | ||
| 20 | Neur | 65.5 (16.8) |
18 (90.0)b | 20.0% (-4.0, 44.0) | |||
| Gen: general; Neur: neuraxial; Anesth: anesthetic; ASA PS: ASA Physical Status; RD: risk difference. | |||||||
| a Mean (SD). | |||||||
| b Satisfied. | |||||||
| c Excellent/good | |||||||
| d Not specified | |||||||
| e Satisfaction with all aspects of anesthesia care | |||||||
| f Very satisfied | |||||||
| g Very good | |||||||
Pooled
Length of Stay
| Study | N | Anesth | PSa | Ageb | LOSb | 0 – 20 days | Country |
|---|---|---|---|---|---|---|---|
| Orthopedic | |||||||
| 30 | Gen | 123 | 69.0 {62-74} |
9.0 {7-10} |
China | ||
| 30 | Neur | 123 | 65.0 {62-68} |
7.5 {6-11} |
|||
| 60 | Gen | 123 | 68.0 (7.0) |
3.0 [1-4] |
Sweden | ||
| 60 | Neur | 123 | 67.0 (7.0) |
3.0 [1-4] |
|||
| 164 | Gen | 1234 | 83.0 [59-99] |
15.9 (13.7) |
UK | ||
| 158 | Neur | 1234 | 82.9 [25-105] |
16.2 (14.6) |
|||
| 33 | Gen | 123 | 75.1 (6.1) |
8.2 |
Greece | ||
| 37 | Neur | 123 | 77.1 (6.5) |
8.2 |
|||
| 60 | Gen | NR | 79.4 (7.7) |
6.5 {5-9} |
South Korea | ||
| 58 | Gen | NR | 80.5 (6.7) |
7.0 {5-9} |
|||
| 58 | Neur | NR | 81.6 (6.7) |
7.0 {5-11} |
|||
| 80 | Gen | NR | 75.4 (5.6) |
4.3 (0.9) |
China | ||
| 80 | Neur | NR | 75.6 (5.5) |
4.1 (1.1) |
|||
| 80 | Neur | NR | 75.0 (5.2) |
4.2 (0.9) |
|||
| 211 | Gen | 6.0 {5-10} |
Canada | ||||
| 210 | Neur | 6.0 {4-9} |
|||||
| 593 | Gen | 3.0 {3-5} |
USA | ||||
| 585 | Neur | 3.0 {2-5} |
|||||
| 154 | Gen | 123 | 74.1 (4.2) |
9.2 (2.1) |
China | ||
| 127 | Neur | 123 | 73.1 (6.2) |
9.0 (2.1) |
|||
| 471 | Gen | 1234 | 77.0 {71-82} |
7.0 {6-10} |
China | ||
| 471 | Neur | 1234 | 77.0 {72-82} |
7.0 {5-10} |
|||
| Various | |||||||
| 217 | Gen | 1234 | 70.8 [61-84] |
8.0 [2-20] |
Denmark | ||
| 211 | Neur | 1234 | 71.1 [61-84] |
9.0 [2-21] |
|||
| Gastrointestinal/Abdominal | |||||||
| 116 | Gen | NR | 74.8 (4.0) |
13.2 (1.3) |
China | ||
| 117 | Neur | NR | 75.7 (4.2) |
9.0 (1.8) |
|||
| Other | |||||||
| 20 | Gen | 123 | 62.6 (10.7) |
9.1 (6.3) |
Italy | ||
| 20 | Neur | 123 | 65.5 (16.8) |
7.2 (3.4) |
|||
| Spine | |||||||
| 106 | Gen | NR | 72.0 {69-76} |
3.0 {2-3} |
USA | ||
| 111 | Neur | NR | 73.0 {69-78} |
3.0 {2-3} |
|||
| Anesth: anesthetic; NR: not reported. | |||||||
| a ASA Physical Status. | |||||||
| b Mean Med (SD)[Range]{IQR}. | |||||||
Pooled
Discharge Location
| Study | N | Arm | Agea | Country | Discharge to Institution | RR (95% CI) | |
|---|---|---|---|---|---|---|---|
| N (%) | 0 — 100% | ||||||
| Randomized Clinical Trial — Orthopedic | |||||||
| 777 | Gen | 78.4 (10.6) |
USA | 586 (75.4) | |||
| 777 | Neur | 77.7 (10.7) |
576 (74.1) | 0.98 (0.93-1.04) | |||
| 279 | Gen | USA | 233 (83.5) | ||||
| 292 | Neur | 208 (71.2) | 0.85 (0.78-0.93) | ||||
| 437 | Gen | USA | 297 (68.0) | ||||
| 431 | Neur | 297 (68.9) | 1.01 (0.93-1.11) | ||||
| Gen: general; Neur: neuraxial; RR: risk ratio. | |||||||
| a Mean Med (SD)[Range]{IQR}. | |||||||
Mortality
| Study | N | Arm | Surgery | ASA | Agea | Mortality | RD (95% CI) | |
|---|---|---|---|---|---|---|---|---|
| PS | N (%) | 0 - 100% | ||||||
| Hospital | ||||||||
| 217 | Gen | Various | 1234 | 70.8 [61-84] |
3 (1.4) | — | ||
| 211 | Neur | 71.1 [61-84] |
0 (0) | -1.4% (-3.2, 0.4) | ||||
| 60 | Gen | Ortho | 123 | 68.0 (7.0) |
0 (0) | — | ||
| 60 | Neur | 67.0 (7.0) |
0 (0) | 0.0% (-3.2, 3.2) | ||||
| 60 | Gen | Ortho | NR | 79.4 (7.7) |
1 (1.7) | — | ||
| 58 | Gen | 80.5 (6.7) |
0 (0) | -1.7% (-6.2, 2.9) | ||||
| 58 | Neur | 81.6 (6.7) |
2 (3.4) | 1.8% (-3.9, 7.5) | ||||
| 106 | Gen | Spine | NR | 72.0 {69-76} |
1 (0.9) | — | ||
| 111 | Neur | 73.0 {69-78} |
0 (0) | -0.9% (-3.5, 1.6) | ||||
| 790 | Gen | Ortho | 1234 | 78.4 (10.6) |
13 (1.6) | — | ||
| 782 | Neur | 77.7 (10.7) |
5 (0.6) | -1.0% (-2.1, 0.0) | ||||
| 30-day | ||||||||
| 164 | Gen | Ortho | 1234 | 83.0 [59-99] |
8 (4.9) | — | ||
| 158 | Neur | 82.9 [25-105] |
5 (3.2) | -1.7% (-6.0, 2.6) | ||||
| 60 | Gen | Ortho | 123 | 68.0 (9.0) |
0 (0) | — | ||
| 58 | Neur | 66.0 (7.8) |
0 (0) | 0.0% (-3.3, 3.3) | ||||
| 21 | Gen | Ortho | 123 | 85.0 (5.0) |
0 (0) | — | ||
| 19 | Neur | 83.0 (6.0) |
0 (0) | 0.0% (-9.3, 9.3) | ||||
| 60 | Gen | Ortho | NR | 79.4 (7.7) |
2 (3.3) | 1.7% (-3.9, 7.2) | ||
| 58 | Gen | 80.5 (6.7) |
1 (1.7) | 0.1% (-4.6, 4.7) | ||||
| 58 | Neur | 81.6 (6.7) |
1 (1.7) | 0.1% (-4.6, 4.7) | ||||
| 464 | Gen | Ortho | 1234 | 77.0 {71-82} |
4 (0.9) | — | ||
| 469 | Neur | 77.0 {72-82} |
8 (1.7) | 0.8% (-0.6, 2.3) | ||||
| 90-day | ||||||||
| 217 | Gen | Various | 1234 | 70.8 [61-84] |
1 (0.5) | -0.9% (-2.7, 0.9) | ||
| 211 | Neur | 71.1 [61-84] |
0 (0) | -1.4% (-3.2, 0.4) | ||||
| 164 | Gen | Ortho | 1234 | 83.0 [59-99] |
12 (7.3) | 2.4% (-2.7, 7.6) | ||
| 158 | Neur | 82.9 [25-105] |
12 (7.6) | 2.7% (-2.6, 8.0) | ||||
| 60 | Gen | Ortho | NR | 79.4 (7.7) |
3 (5.0) | 3.3% (-3.1, 9.7) | ||
| 58 | Gen | 80.5 (6.7) |
2 (3.4) | 1.8% (-3.9, 7.5) | ||||
| 58 | Neur | 81.6 (6.7) |
3 (5.2) | 3.5% (-3.1, 10.1) | ||||
| 1-year | ||||||||
| 164 | Gen | Ortho | 1234 | 83.0 [59-99] |
19 (11.6) | 6.7% (0.8, 12.6) | ||
| 158 | Neur | 82.9 [25-105] |
32 (20.3) | 15.4% (8.3, 22.5) | ||||
| ASA PS: American Society of Anesthesiologists Physical Status; RD: risk difference; GI: gastrointestinal; Abd: abdominal (includes hepatic); Various: more that one procedure category. | ||||||||
| a Mean Med (SD)[Range]{IQR}. | ||||||||
Pooled
Other RR 0.20 (95% CI, 0.02–1.71)
Hip fracture RD -3.6 (95% CI, -16.6 to 9.5)
Other RD -8.8 (95% CI, -21.1 to 3.6)
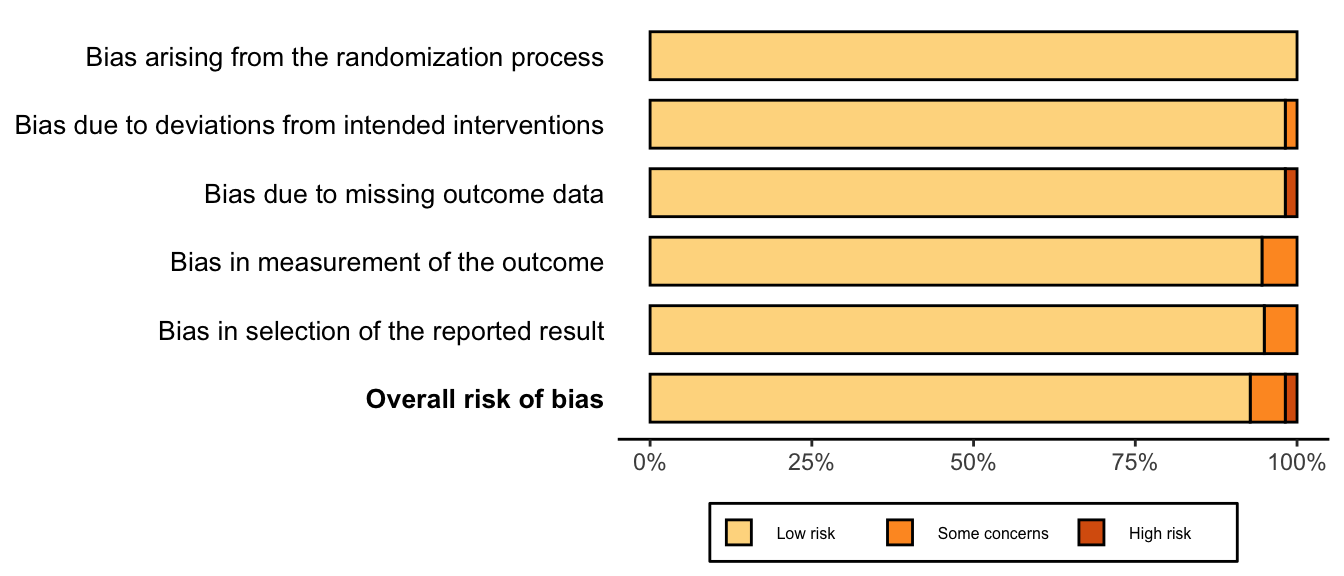
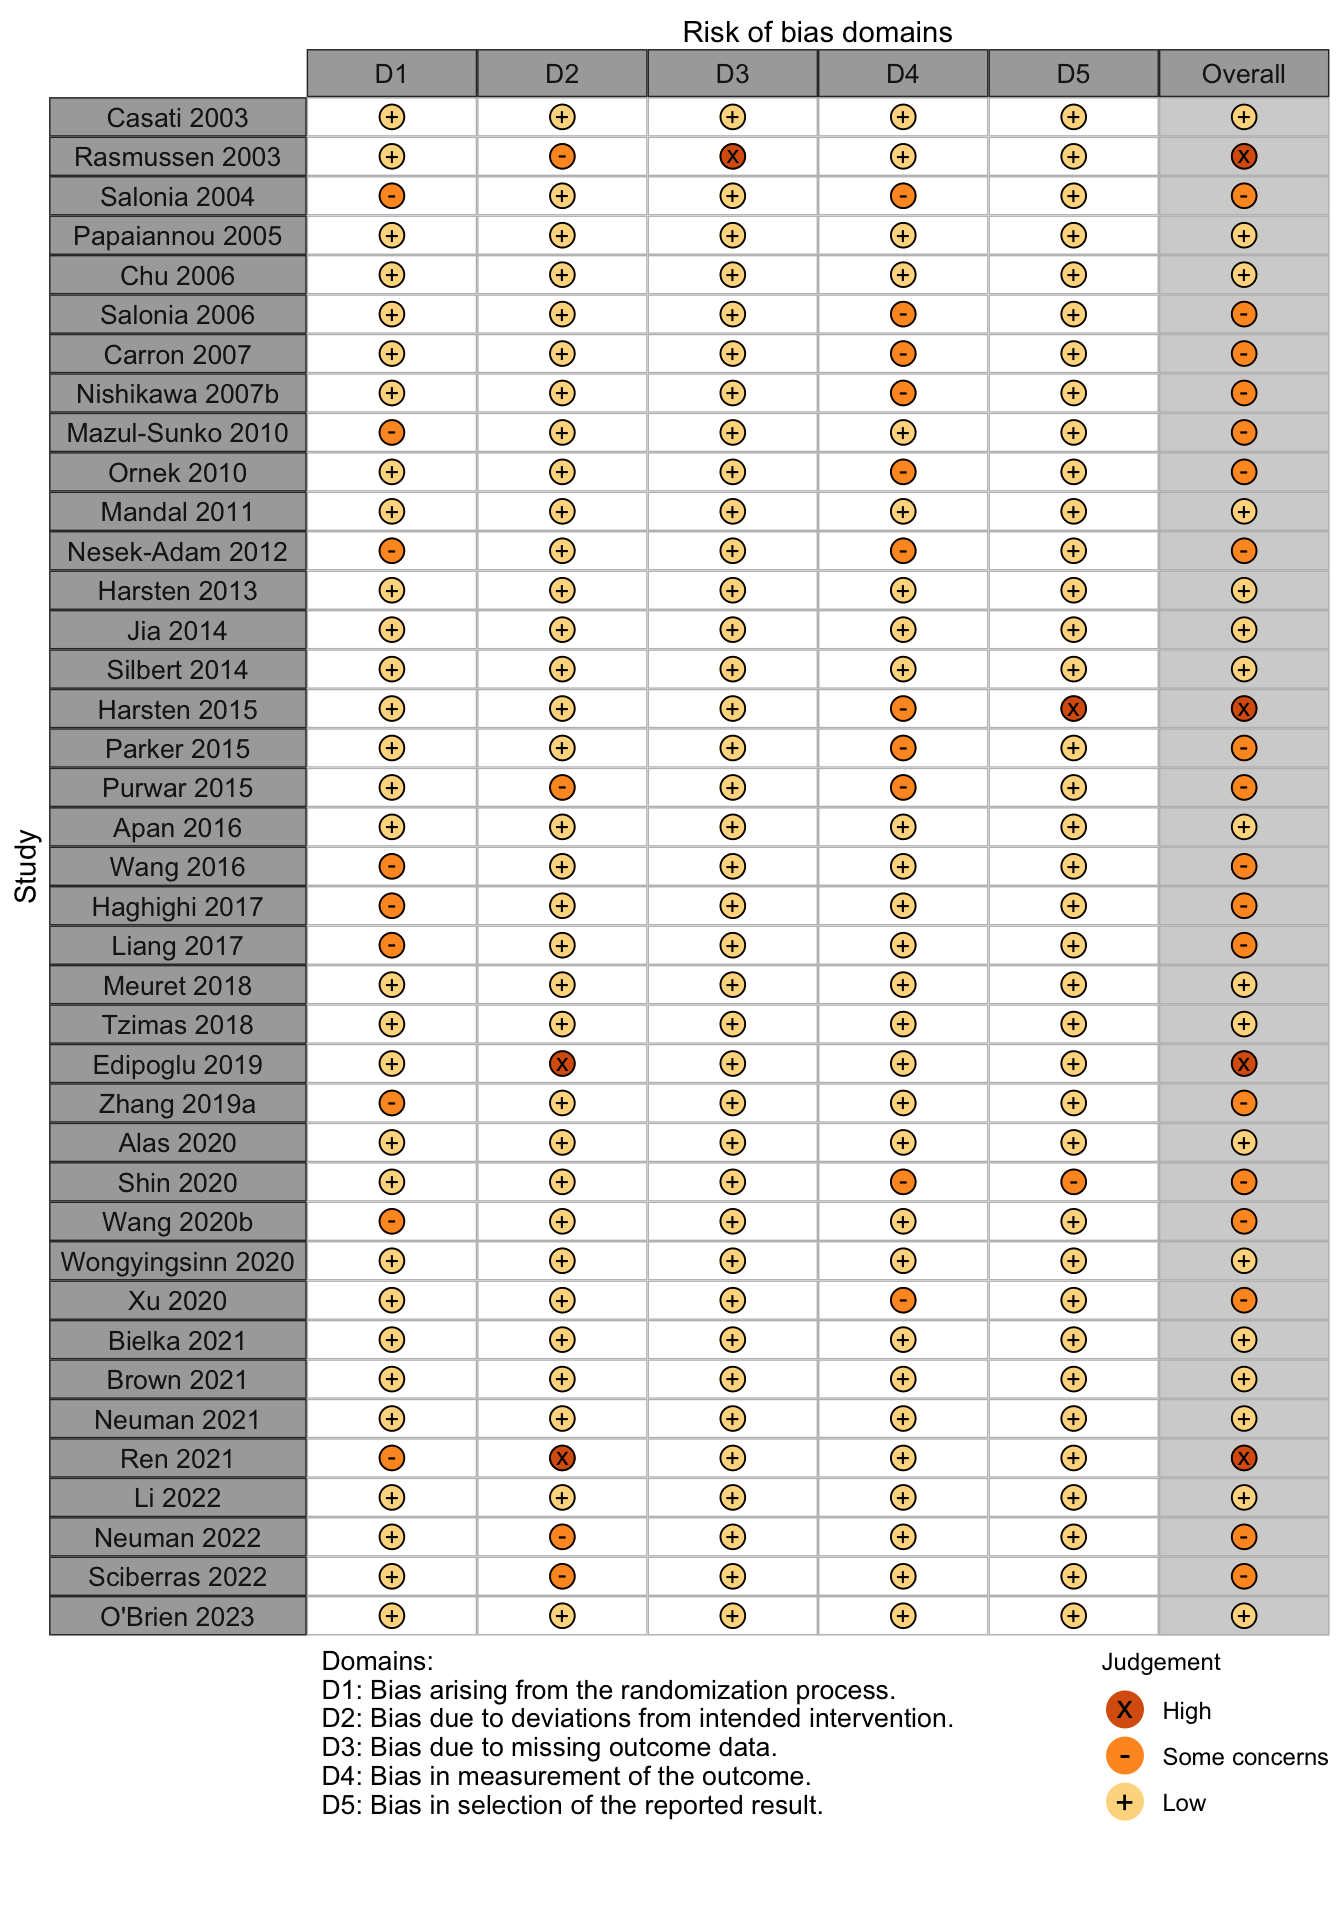
Risk of Bias
References
1.
Alas A, Martin L, Devakumar H, Frank L, Vaish S, Chandrasekaran N, Davila GW, Hurtado E: Anesthetics’ role in postoperative urinary retention after pelvic organ prolapse surgery with concomitant midurethral slings: A randomized clinical trial. Int Urogynecol J 2020; 31:205–13
2.
Apan A, Cuvas Apan O, Kose EA: Segmental epidural anesthesia for percutaneous kyphoplasty:comparison with general anesthesia. Turk J Med Sci 2016; 46:1801–7
3.
Bielka K, Kuchyn I, Tokar I, Artemenko V, Kashchii U: Psoas compartment block efficacy and safety for perioperative analgesia in the elderly with proximal femur fractures: A randomized controlled study. BMC Anesthesiol 2022; 21:252
4.
Brown CH, Edwards C, Lin C, Jones EL, Yanek LR, Esmaili M, Gorashi Y, Skelton R, Kaganov D, Curto R, Lessing NL, Cha S, Colantuoni E, Neufeld K, Sieber F, Dean CL, Hogue CW: Spinal anesthesia with targeted sedation based on bispectral index values compared with general anesthesia with masked bispectral index values to reduce delirium: The SHARP randomized controlled trial. Anesthesiology 2022; 135:992–1003
5.
Carron M, Freo U, Innocente F, Veronese S, Pilati P, Jevtovic-Todorovic V, Ori C: Recovery profiles of general anesthesia and spinal anesthesia for chemotherapeutic perfusion with circulatory block (stop-flow perfusion). Anesth Analg 2007; 105:1500–3, table of contents
6.
Casati A, Aldegheri G, Vinciguerra E, Marsan A, Fraschini G, Torri G: Randomized comparison between sevoflurane anaesthesia and unilateral spinal anaesthesia in elderly patients undergoing orthopaedic surgery. Eur J Anaesthesiol 2003; 20:640–6
7.
Chu CPW, Yap JCCM, Chen PP, Hung HH: Postoperative outcome in chinese patients having primary total knee arthroplasty under general anaesthesia/intravenous patient-controlled analgesia compared to spinal-epidural anaesthesia/analgesia. Hong Kong Medical Journal 2006; 12:442–7
8.
Edipoglu IS, Celik F: The associations between cognitive dysfunction, stress biomarkers, and administered anesthesia type in total knee arthroplasties: Prospective, randomized trial. Pain Physician 2019; 22:495–507
9.
Haghighi M, Sedighinejad A, Nabi BN, Mardani-Kivi M, Tehran SG, Mirfazli SA, Mirbolook A, Saheli NA: Is spinal anesthesia with low dose lidocaine better than sevoflorane anesthesia in patients undergoing hip fracture surgery. Archives of Bone and Joint Surgery 2017; 5:226–30
10.
Harsten A, Kehlet H, Ljung P, Toksvig-Larsen S: Total intravenous general anaesthesia vs. Spinal anaesthesia for total hip arthroplasty: A randomised, controlled trial. Acta Anaesthesiol Scand 2015; 59:298–309
11.
Harsten A, Kehlet H, Toksvig-Larsen S: Recovery after total intravenous general anaesthesia or spinal anaesthesia for total knee arthroplasty: A randomized trial. Br J Anaesth 2013; 111:391–9
12.
Jia Y, Jin G, Guo S, Gu B, Jin Z, Gao X, Li Z: Fast-track surgery decreases the incidence of postoperative delirium and other complications in elderly patients with colorectal carcinoma. Langenbecks Arch Surg 2014; 399:77–84
13.
Li T, Li J, Yuan L, Wu J, Jiang C, Daniels J, Mehta RL, Wang M, Yeung J, Jackson T, Melody T, Jin S, Yao Y, Wu J, Chen J, Smith FG, Lian Q, Investigators RS: Effect of regional vs general anesthesia on incidence of postoperative delirium in older patients undergoing hip fracture surgery: The RAGA randomized trial. JAMA 2022; 327:50–8
14.
Liang C, Wei J, Cai X, Lin W, Fan Y, Yang F: Efficacy and safety of 3 different anesthesia techniques used in total hip arthroplasty. Med Sci Monit 2017; 23:3752–9
15.
Mandal S, Basu M, Kirtania J, Sarbapalli D, Pal R, Kar S, Kundu KK, Sarkar U, Gupta SD: Impact of general versus epidural anesthesia on early post-operative cognitive dysfunction following hip and knee surgery. J Emerg Trauma Shock 2011; 4:23–8
16.
Mazul-Sunko B, Hromatko I, Tadinac M, Sekulić A, Ivanec Z, Gvozdenović A, Tomasević B, Gavranović Z, Mladić-Batinica I, Cima A, Vrkić N, Lovricević I: Subclinical neurocognitive dysfunction after carotid endarterectomy-the impact of shunting. J Neurosurg Anesthesiol 2010; 22:195–201
17.
Meuret P, Bouvet L, Villet B, Hafez M, Allaouchiche B, Boselli E: Hypobaric unilateral spinal anaesthesia versus general anaesthesia in elderly patients undergoing hip fracture surgical repair: A prospective randomised open trial. Turk J Anaesthesiol Reanim 2018; 46:121–30
18.
Nesek-Adam V, Rasić Z, Schwarz D, Grizelj-Stojcić E, Rasić D, Krstonijević Z, Markić A, Kovacević M: The effect of spinal versus general anesthesia on postoperative pain and analgesic requirements in patients undergoing peripheral vascular surgery. Coll Antropol 2012; 36:1301–5
19.
Neuman MD, Feng R, Carson JL, Gaskins LJ, Dillane D, Sessler DI, Sieber F, Magaziner J, Marcantonio ER, Mehta S, Menio D, Ayad S, Stone T, Papp S, Schwenk ES, Elkassabany N, Marshall M, Jaffe JD, Luke C, Sharma B, Azim S, Hymes RA, Chin KJ, Sheppard R, Perlman B, Sappenfield J, Hauck E, Hoeft MA, Giska M, Ranganath Y, et al.: Spinal anesthesia or general anesthesia for hip surgery in older adults. N Engl J Med 2022; 385:2025–35
20.
Neuman MD, Feng R, Ellenberg SS, Sieber F, Sessler DI, Magaziner J, Elkassabany N, Schwenk ES, Dillane D, Marcantonio ER, Menio D, Ayad S, Hassan M, Stone T, Papp S, Donegan D, Marshall M, Jaffe JD, Luke C, Sharma B, Azim S, Hymes R, Chin KJ, Sheppard R, Perlman B, Sappenfield J, Hauck E, Hoeft MA, Tierney A, Gaskins LJ, et al.: Pain, analgesic use, and patient satisfaction with spinal versus general anesthesia for hip fracture surgery: A randomized clinical trial. Ann Intern Med 2022; 175:952–60
21.
Nishikawa K, Yoshida S, Shimodate Y, Igarashi M, Namiki A: A comparison of spinal anesthesia with small-dose lidocaine and general anesthesia with fentanyl and propofol for ambulatory prostate biopsy procedures in elderly patients. J Clin Anesth 2007; 19:25–9
22.
O’Brien K, Feng R, Sieber F, Marcantonio ER, Tierney A, Magaziner J, Carson JL, Dillane D, Sessler DI, Menio D, Ayad S, Stone T, Papp S, Schwenk ES, Marshall M, Jaffe JD, Luke C, Sharma B, Azim S, Hymes R, Chin KJ, Sheppard R, Perlman B, Sappenfield J, Hauck E, Hoeft MA, Karlawish J, Mehta S, Donegan DJ, Horan A, et al.: Outcomes with spinal versus general anesthesia for patients with and without preoperative cognitive impairment: Secondary analysis of a randomized clinical trial. Alzheimer’s and Dementia 2023; 19:4008–19
23.
Ornek D, Metin S, Deren S, Un C, Metin M, Dikmen B, Gogus N: The influence of various anesthesia techniques on postoperative recovery and discharge criteria among geriatric patients. Clinics (Sao Paulo) 2010; 65:941–6
24.
Papaioannou A, Fraidakis O, Michaloudis D, Balalis C, Askitopoulou H: The impact of the type of anaesthesia on cognitive status and delirium during the first postoperative days in elderly patients. Eur J Anaesthesiol 2005; 22:492–9
25.
Parker MJ, Griffiths R: General versus regional anaesthesia for hip fractures. A pilot randomised controlled trial of 322 patients. Injury 2015; 46:1562–6
26.
Purwar B, Ismail KM, Turner N, Farrell A, Verzune M, Annappa M, Smith I, El-Gizawy Z, Cooper JC: General or spinal anaesthetic for vaginal surgery in pelvic floor disorders (GOSSIP): A feasibility randomised controlled trial. Int Urogynecol J 2015; 26:1171–8
27.
Rasmussen LS, Johnson T, Kuipers HM, Kristensen D, Siersma VD, Vila P, Jolles J, Papaioannou A, Abildstrom H, Silverstein JH, Bonal JA, Raeder J, Nielsen IK, Korttila K, Munoz L, Dodds C, Hanning CD, Moller JT: Does anaesthesia cause postoperative cognitive dysfunction? A randomised study of regional versus general anaesthesia in 438 elderly patients. Acta Anaesthesiol Scand 2003; 47:260–6
28.
Ren WX, Wu RR: Effect of general and sub-arachnoid anesthesia on the incidence of postoperative delirium and cognitive impairments in elderly chinese patients. Tropical Journal of Pharmaceutical Research 2021; 20:433–9
29.
Salonia A, Crescenti A, Suardi N, Memmo A, Naspro R, Bocciardi AM, Colombo R, Da Pozzo LF, Rigatti P, Montorsi F: General versus spinal anesthesia in patients undergoing radical retropubic prostatectomy: Results of a prospective, randomized study. Urology 2004; 64:95–100
30.
Salonia A, Suardi N, Crescenti A, Colombo R, Rigatti P, Montorsi F: General versus spinal anesthesia with different forms of sedation in patients undergoing radical retropubic prostatectomy: Results of a prospective, randomized study. Int J Urol 2006; 13:1185–90
31.
Sciberras SC, Vella AP, Vella B, Spiteri J, Mizzi C, Borg-Xuereb K, Laferla G, Grech G, Sammut F: A randomized, controlled trial on the effect of anesthesia on chronic pain after total knee arthroplasty. Pain Management 2022; 12:711–23
32.
Shin S, Kim SH, Park KK, Kim SJ, Bae JC, Choi YS: Effects of anesthesia techniques on outcomes after hip fracture surgery in elderly patients: A prospective, randomized, controlled trial. J Clin Med 2020; 9
33.
Silbert BS, Evered LA, Scott DA: Incidence of postoperative cognitive dysfunction after general or spinal anaesthesia for extracorporeal shock wave lithotripsy. Br J Anaesth 2014; 113:784–91
34.
Tzimas P, Samara E, Petrou A, Korompilias A, Chalkias A, Papadopoulos G: The influence of anesthetic techniques on postoperative cognitive function in elderly patients undergoing hip fracture surgery: General vs spinal anesthesia. Injury 2018; 49:2221–6
35.
Wang Q, Lin F, Huang B, Pan LH: The effectiveness and safety of general and spinal anesthesia on systemic inflammatory response in patients with tumor-type total knee arthroplasty. Oncol Res Treat 2020; 43:428–34
36.
Wang Y, Zhang J, Zhang S: Influence of different anesthetic and analgesic methods on early cognitive function of elderly patients receiving non-cardiac surgery. Pak J Med Sci 2016; 32:369–72
37.
Wongyingsinn M, Kohmongkoludom P, Trakarnsanga A, Horthongkham N: Postoperative clinical outcomes and inflammatory markers after inguinal hernia repair using local, spinal, or general anesthesia: A randomized controlled trial. PLoS One 2020; 15:e0242925
38.
Xu CS, Qu XD, Qu ZJ, Wang G, Wang HJ: Effect of subarachnoid anesthesia combined with propofol target-controlled infusion on blood loss and transfusion for posterior total hip arthroplasty in elderly patients. Chin Med J (Engl) 2020; 133:650–6
39.
Zhang X, Dong Q, Fang J: Impacts of general and spinal anaesthesia on short-term cognitive function and mental status in elderly patients undergoing orthopaedic surgery. J Coll Physicians Surg Pak 2019; 29:101–4